Barbadian vs Immigrants from Kuwait 4 or more Vehicles in Household
COMPARE
Barbadian
Immigrants from Kuwait
4 or more Vehicles in Household
4 or more Vehicles in Household Comparison
Barbadians
Immigrants from Kuwait
3.9%
4 OR MORE VEHICLES IN HOUSEHOLD
0.0/ 100
METRIC RATING
335th/ 347
METRIC RANK
6.2%
4 OR MORE VEHICLES IN HOUSEHOLD
28.0/ 100
METRIC RATING
193rd/ 347
METRIC RANK
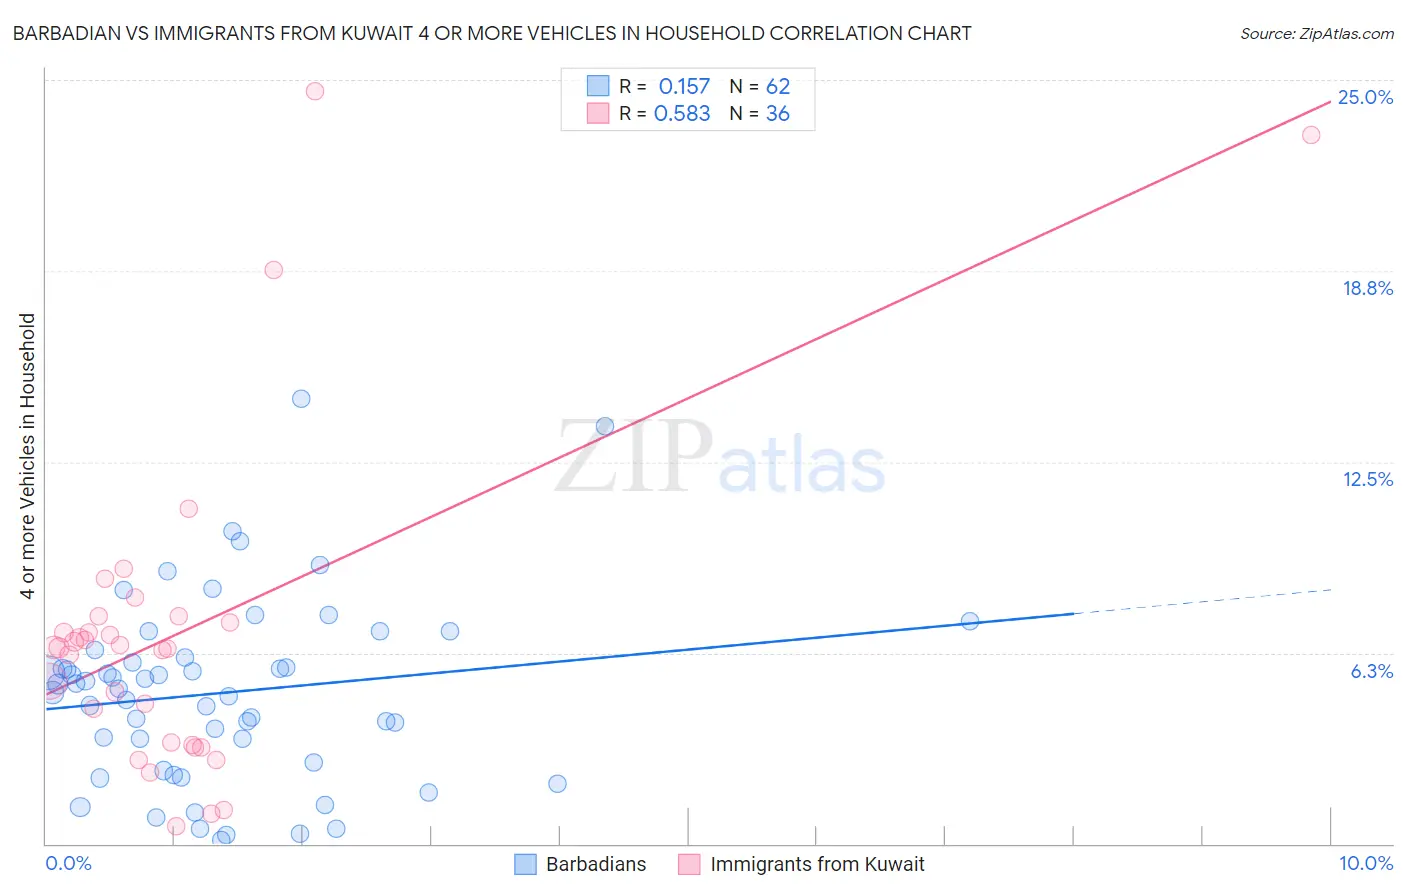
Barbadian vs Immigrants from Kuwait 4 or more Vehicles in Household Correlation Chart
The statistical analysis conducted on geographies consisting of 140,490,439 people shows a poor positive correlation between the proportion of Barbadians and percentage of households with 4 or more vehicles available in the United States with a correlation coefficient (R) of 0.157 and weighted average of 3.9%. Similarly, the statistical analysis conducted on geographies consisting of 136,548,104 people shows a substantial positive correlation between the proportion of Immigrants from Kuwait and percentage of households with 4 or more vehicles available in the United States with a correlation coefficient (R) of 0.583 and weighted average of 6.2%, a difference of 58.1%.
4 or more Vehicles in Household Correlation Summary
| Measurement | Barbadian | Immigrants from Kuwait |
| Minimum | 0.11% | 0.56% |
| Maximum | 14.6% | 24.6% |
| Range | 14.5% | 24.1% |
| Mean | 4.9% | 6.9% |
| Median | 5.1% | 6.4% |
| Interquartile 25% (IQ1) | 2.7% | 3.3% |
| Interquartile 75% (IQ3) | 6.1% | 7.3% |
| Interquartile Range (IQR) | 3.4% | 4.1% |
| Standard Deviation (Sample) | 3.0% | 5.3% |
| Standard Deviation (Population) | 3.0% | 5.2% |
Similar Demographics by 4 or more Vehicles in Household
Demographics Similar to Barbadians by 4 or more Vehicles in Household
In terms of 4 or more vehicles in household, the demographic groups most similar to Barbadians are Immigrants from Bangladesh (3.9%, a difference of 0.18%), Vietnamese (3.9%, a difference of 0.69%), Immigrants from Cabo Verde (3.8%, a difference of 2.5%), Immigrants from Trinidad and Tobago (4.1%, a difference of 5.2%), and Immigrants from Albania (4.1%, a difference of 5.4%).
| Demographics | Rating | Rank | 4 or more Vehicles in Household |
| Trinidadians and Tobagonians | 0.0 /100 | #328 | Tragic 4.3% |
| Immigrants | Senegal | 0.0 /100 | #329 | Tragic 4.2% |
| Immigrants | Ecuador | 0.0 /100 | #330 | Tragic 4.2% |
| West Indians | 0.0 /100 | #331 | Tragic 4.2% |
| Immigrants | Dominica | 0.0 /100 | #332 | Tragic 4.2% |
| Immigrants | Albania | 0.0 /100 | #333 | Tragic 4.1% |
| Immigrants | Trinidad and Tobago | 0.0 /100 | #334 | Tragic 4.1% |
| Barbadians | 0.0 /100 | #335 | Tragic 3.9% |
| Immigrants | Bangladesh | 0.0 /100 | #336 | Tragic 3.9% |
| Vietnamese | 0.0 /100 | #337 | Tragic 3.9% |
| Immigrants | Cabo Verde | 0.0 /100 | #338 | Tragic 3.8% |
| Immigrants | Uzbekistan | 0.0 /100 | #339 | Tragic 3.6% |
| Immigrants | Barbados | 0.0 /100 | #340 | Tragic 3.6% |
| Dominicans | 0.0 /100 | #341 | Tragic 3.5% |
| Guyanese | 0.0 /100 | #342 | Tragic 3.5% |
Demographics Similar to Immigrants from Kuwait by 4 or more Vehicles in Household
In terms of 4 or more vehicles in household, the demographic groups most similar to Immigrants from Kuwait are Immigrants from Sweden (6.2%, a difference of 0.13%), Argentinean (6.2%, a difference of 0.13%), Tsimshian (6.2%, a difference of 0.20%), Romanian (6.2%, a difference of 0.34%), and Inupiat (6.2%, a difference of 0.35%).
| Demographics | Rating | Rank | 4 or more Vehicles in Household |
| Immigrants | Northern Europe | 36.8 /100 | #186 | Fair 6.2% |
| Immigrants | South Africa | 35.4 /100 | #187 | Fair 6.2% |
| Kiowa | 34.7 /100 | #188 | Fair 6.2% |
| Immigrants | Eastern Asia | 33.3 /100 | #189 | Fair 6.2% |
| South Africans | 32.2 /100 | #190 | Fair 6.2% |
| Inupiat | 30.7 /100 | #191 | Fair 6.2% |
| Romanians | 30.7 /100 | #192 | Fair 6.2% |
| Immigrants | Kuwait | 28.0 /100 | #193 | Fair 6.2% |
| Immigrants | Sweden | 27.0 /100 | #194 | Fair 6.2% |
| Argentineans | 27.0 /100 | #195 | Fair 6.2% |
| Tsimshian | 26.4 /100 | #196 | Fair 6.2% |
| Immigrants | Sri Lanka | 23.7 /100 | #197 | Fair 6.1% |
| Immigrants | Portugal | 22.3 /100 | #198 | Fair 6.1% |
| Immigrants | Norway | 21.8 /100 | #199 | Fair 6.1% |
| Latvians | 21.7 /100 | #200 | Fair 6.1% |