Palestinian vs Immigrants from Eritrea No Vehicles in Household
COMPARE
Palestinian
Immigrants from Eritrea
No Vehicles in Household
No Vehicles in Household Comparison
Palestinians
Immigrants from Eritrea
8.3%
NO VEHICLES IN HOUSEHOLD
99.7/ 100
METRIC RATING
66th/ 347
METRIC RANK
10.6%
NO VEHICLES IN HOUSEHOLD
36.3/ 100
METRIC RATING
189th/ 347
METRIC RANK
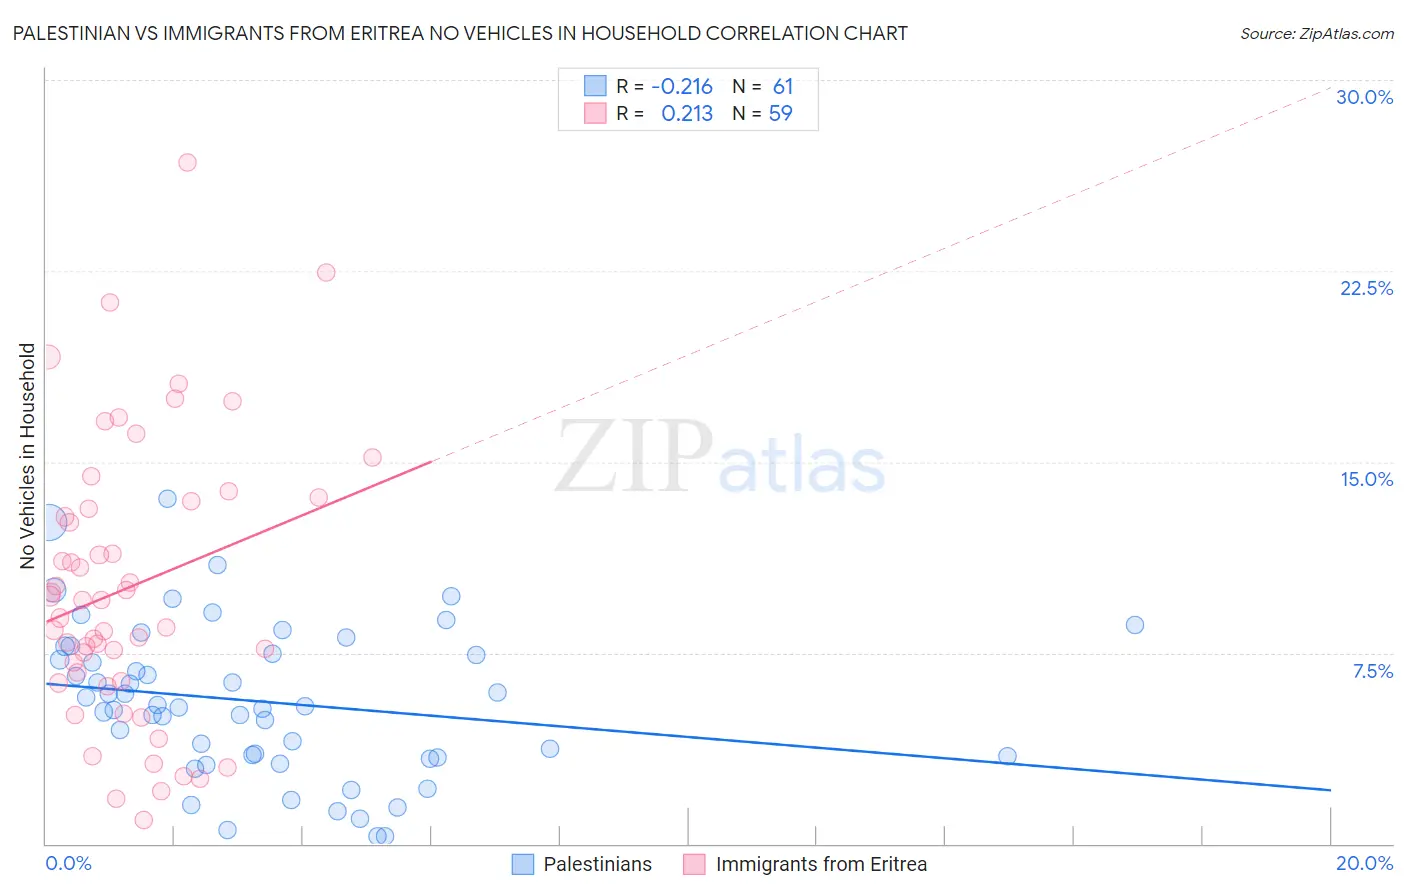
Palestinian vs Immigrants from Eritrea No Vehicles in Household Correlation Chart
The statistical analysis conducted on geographies consisting of 216,223,800 people shows a weak negative correlation between the proportion of Palestinians and percentage of households with no vehicle available in the United States with a correlation coefficient (R) of -0.216 and weighted average of 8.3%. Similarly, the statistical analysis conducted on geographies consisting of 104,832,678 people shows a weak positive correlation between the proportion of Immigrants from Eritrea and percentage of households with no vehicle available in the United States with a correlation coefficient (R) of 0.213 and weighted average of 10.6%, a difference of 27.3%.
No Vehicles in Household Correlation Summary
| Measurement | Palestinian | Immigrants from Eritrea |
| Minimum | 0.29% | 0.94% |
| Maximum | 13.6% | 26.8% |
| Range | 13.3% | 25.8% |
| Mean | 5.6% | 10.1% |
| Median | 5.4% | 9.6% |
| Interquartile 25% (IQ1) | 3.4% | 6.4% |
| Interquartile 75% (IQ3) | 7.6% | 13.4% |
| Interquartile Range (IQR) | 4.2% | 7.1% |
| Standard Deviation (Sample) | 3.0% | 5.5% |
| Standard Deviation (Population) | 3.0% | 5.4% |
Similar Demographics by No Vehicles in Household
Demographics Similar to Palestinians by No Vehicles in Household
In terms of no vehicles in household, the demographic groups most similar to Palestinians are Immigrants from Scotland (8.3%, a difference of 0.010%), Canadian (8.3%, a difference of 0.11%), Immigrants from Iran (8.4%, a difference of 0.41%), Spaniard (8.4%, a difference of 0.46%), and Croatian (8.3%, a difference of 0.86%).
| Demographics | Rating | Rank | No Vehicles in Household |
| Immigrants | India | 99.8 /100 | #59 | Exceptional 8.2% |
| Immigrants | Laos | 99.8 /100 | #60 | Exceptional 8.2% |
| Thais | 99.8 /100 | #61 | Exceptional 8.2% |
| Chinese | 99.8 /100 | #62 | Exceptional 8.2% |
| Slovaks | 99.8 /100 | #63 | Exceptional 8.3% |
| Croatians | 99.8 /100 | #64 | Exceptional 8.3% |
| Canadians | 99.7 /100 | #65 | Exceptional 8.3% |
| Palestinians | 99.7 /100 | #66 | Exceptional 8.3% |
| Immigrants | Scotland | 99.7 /100 | #67 | Exceptional 8.3% |
| Immigrants | Iran | 99.7 /100 | #68 | Exceptional 8.4% |
| Spaniards | 99.7 /100 | #69 | Exceptional 8.4% |
| Cajuns | 99.6 /100 | #70 | Exceptional 8.4% |
| Immigrants | Lebanon | 99.6 /100 | #71 | Exceptional 8.4% |
| Lithuanians | 99.6 /100 | #72 | Exceptional 8.4% |
| Poles | 99.6 /100 | #73 | Exceptional 8.4% |
Demographics Similar to Immigrants from Eritrea by No Vehicles in Household
In terms of no vehicles in household, the demographic groups most similar to Immigrants from Eritrea are Immigrants from Armenia (10.6%, a difference of 0.18%), Immigrants from North Macedonia (10.6%, a difference of 0.23%), Immigrants from Poland (10.6%, a difference of 0.30%), Immigrants from Northern Europe (10.7%, a difference of 0.47%), and Carpatho Rusyn (10.7%, a difference of 0.61%).
| Demographics | Rating | Rank | No Vehicles in Household |
| Immigrants | Bulgaria | 43.8 /100 | #182 | Average 10.5% |
| Natives/Alaskans | 43.7 /100 | #183 | Average 10.5% |
| Immigrants | Nepal | 42.4 /100 | #184 | Average 10.5% |
| South Americans | 41.9 /100 | #185 | Average 10.5% |
| German Russians | 40.6 /100 | #186 | Average 10.5% |
| Immigrants | Poland | 38.4 /100 | #187 | Fair 10.6% |
| Immigrants | Armenia | 37.5 /100 | #188 | Fair 10.6% |
| Immigrants | Eritrea | 36.3 /100 | #189 | Fair 10.6% |
| Immigrants | North Macedonia | 34.6 /100 | #190 | Fair 10.6% |
| Immigrants | Northern Europe | 33.1 /100 | #191 | Fair 10.7% |
| Carpatho Rusyns | 32.1 /100 | #192 | Fair 10.7% |
| Ukrainians | 28.0 /100 | #193 | Fair 10.7% |
| Pueblo | 27.0 /100 | #194 | Fair 10.8% |
| Immigrants | Brazil | 26.3 /100 | #195 | Fair 10.8% |
| Central Americans | 24.3 /100 | #196 | Fair 10.8% |