Iraqi vs Immigrants from Belarus 2 or more Vehicles in Household
COMPARE
Iraqi
Immigrants from Belarus
2 or more Vehicles in Household
2 or more Vehicles in Household Comparison
Iraqis
Immigrants from Belarus
57.1%
2 OR MORE VEHICLES IN HOUSEHOLD
95.8/ 100
METRIC RATING
117th/ 347
METRIC RANK
47.9%
2 OR MORE VEHICLES IN HOUSEHOLD
0.0/ 100
METRIC RATING
311th/ 347
METRIC RANK
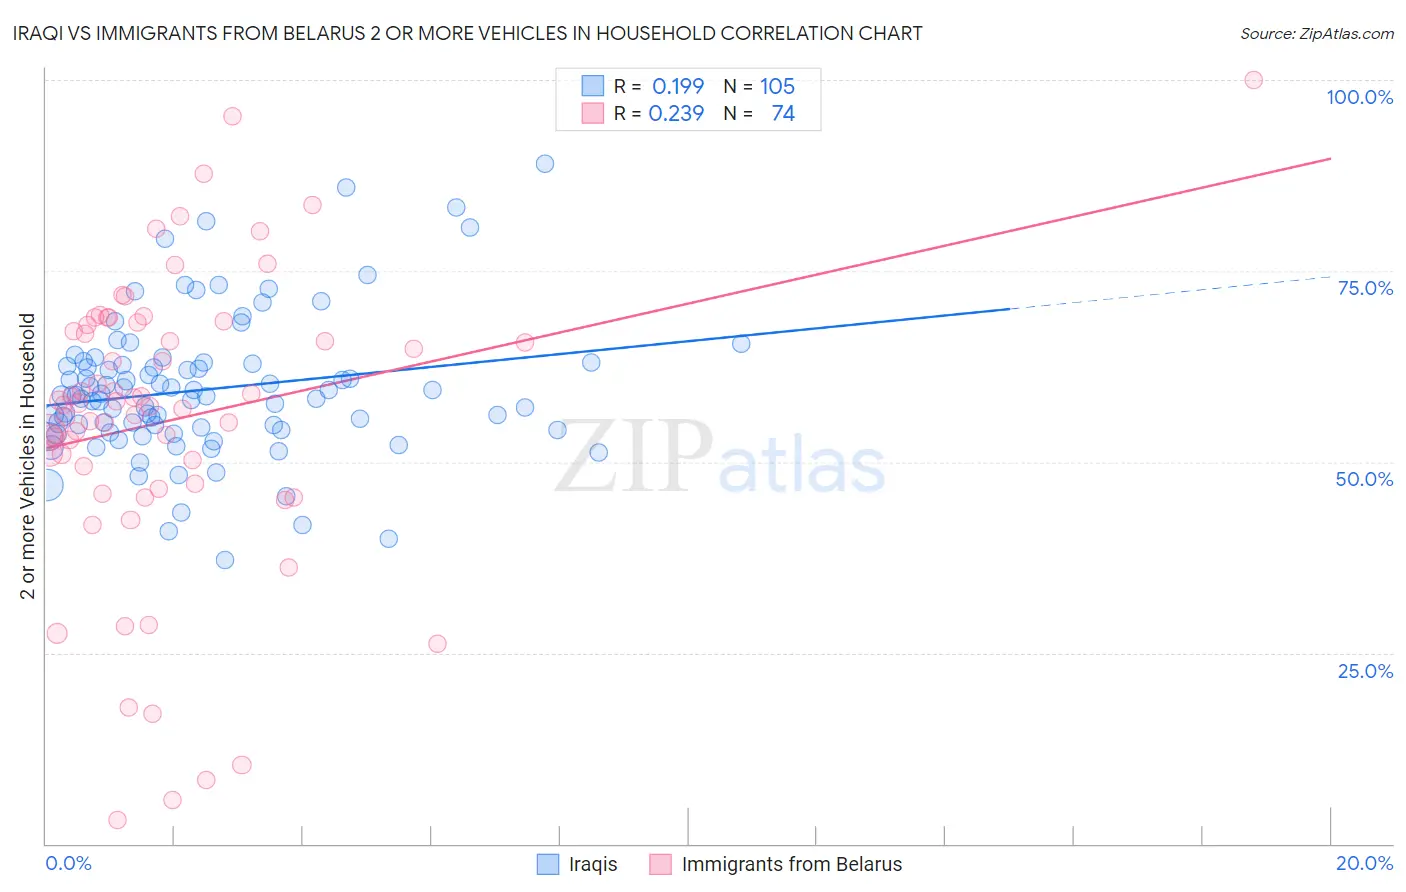
Iraqi vs Immigrants from Belarus 2 or more Vehicles in Household Correlation Chart
The statistical analysis conducted on geographies consisting of 170,650,465 people shows a poor positive correlation between the proportion of Iraqis and percentage of households with 2 or more vehicles available in the United States with a correlation coefficient (R) of 0.199 and weighted average of 57.1%. Similarly, the statistical analysis conducted on geographies consisting of 150,189,140 people shows a weak positive correlation between the proportion of Immigrants from Belarus and percentage of households with 2 or more vehicles available in the United States with a correlation coefficient (R) of 0.239 and weighted average of 47.9%, a difference of 19.1%.
2 or more Vehicles in Household Correlation Summary
| Measurement | Iraqi | Immigrants from Belarus |
| Minimum | 37.2% | 3.0% |
| Maximum | 89.1% | 100.0% |
| Range | 51.9% | 97.0% |
| Mean | 59.5% | 55.5% |
| Median | 58.7% | 57.6% |
| Interquartile 25% (IQ1) | 54.1% | 47.1% |
| Interquartile 75% (IQ3) | 62.9% | 67.9% |
| Interquartile Range (IQR) | 8.7% | 20.9% |
| Standard Deviation (Sample) | 9.3% | 19.6% |
| Standard Deviation (Population) | 9.3% | 19.4% |
Similar Demographics by 2 or more Vehicles in Household
Demographics Similar to Iraqis by 2 or more Vehicles in Household
In terms of 2 or more vehicles in household, the demographic groups most similar to Iraqis are Asian (57.0%, a difference of 0.16%), Immigrants from Jordan (57.2%, a difference of 0.19%), Native/Alaskan (57.0%, a difference of 0.19%), Chippewa (57.2%, a difference of 0.20%), and Costa Rican (56.9%, a difference of 0.24%).
| Demographics | Rating | Rank | 2 or more Vehicles in Household |
| Japanese | 98.0 /100 | #110 | Exceptional 57.5% |
| Greeks | 98.0 /100 | #111 | Exceptional 57.5% |
| Pueblo | 98.0 /100 | #112 | Exceptional 57.5% |
| Zimbabweans | 96.9 /100 | #113 | Exceptional 57.2% |
| Immigrants | Lebanon | 96.8 /100 | #114 | Exceptional 57.2% |
| Chippewa | 96.6 /100 | #115 | Exceptional 57.2% |
| Immigrants | Jordan | 96.6 /100 | #116 | Exceptional 57.2% |
| Iraqis | 95.8 /100 | #117 | Exceptional 57.1% |
| Asians | 95.1 /100 | #118 | Exceptional 57.0% |
| Natives/Alaskans | 95.0 /100 | #119 | Exceptional 57.0% |
| Costa Ricans | 94.7 /100 | #120 | Exceptional 56.9% |
| Sioux | 93.8 /100 | #121 | Exceptional 56.8% |
| Immigrants | South Africa | 92.5 /100 | #122 | Exceptional 56.7% |
| Australians | 91.8 /100 | #123 | Exceptional 56.7% |
| New Zealanders | 91.8 /100 | #124 | Exceptional 56.7% |
Demographics Similar to Immigrants from Belarus by 2 or more Vehicles in Household
In terms of 2 or more vehicles in household, the demographic groups most similar to Immigrants from Belarus are Ghanaian (48.0%, a difference of 0.12%), Haitian (47.6%, a difference of 0.74%), U.S. Virgin Islander (47.5%, a difference of 0.91%), Immigrants from Ghana (47.4%, a difference of 1.1%), and Puerto Rican (47.1%, a difference of 1.7%).
| Demographics | Rating | Rank | 2 or more Vehicles in Household |
| Immigrants | Belize | 0.0 /100 | #304 | Tragic 49.9% |
| Immigrants | Western Africa | 0.0 /100 | #305 | Tragic 49.4% |
| Immigrants | Israel | 0.0 /100 | #306 | Tragic 49.2% |
| Hopi | 0.0 /100 | #307 | Tragic 49.0% |
| Albanians | 0.0 /100 | #308 | Tragic 49.0% |
| Moroccans | 0.0 /100 | #309 | Tragic 48.8% |
| Ghanaians | 0.0 /100 | #310 | Tragic 48.0% |
| Immigrants | Belarus | 0.0 /100 | #311 | Tragic 47.9% |
| Haitians | 0.0 /100 | #312 | Tragic 47.6% |
| U.S. Virgin Islanders | 0.0 /100 | #313 | Tragic 47.5% |
| Immigrants | Ghana | 0.0 /100 | #314 | Tragic 47.4% |
| Puerto Ricans | 0.0 /100 | #315 | Tragic 47.1% |
| Cape Verdeans | 0.0 /100 | #316 | Tragic 46.8% |
| Immigrants | Haiti | 0.0 /100 | #317 | Tragic 46.5% |
| Immigrants | Albania | 0.0 /100 | #318 | Tragic 46.0% |