Immigrants from Haiti vs Immigrants from Latvia 1 or more Vehicles in Household
COMPARE
Immigrants from Haiti
Immigrants from Latvia
1 or more Vehicles in Household
1 or more Vehicles in Household Comparison
Immigrants from Haiti
Immigrants from Latvia
84.7%
1 OR MORE VEHICLES IN HOUSEHOLD
0.0/ 100
METRIC RATING
309th/ 347
METRIC RANK
88.1%
1 OR MORE VEHICLES IN HOUSEHOLD
0.9/ 100
METRIC RATING
255th/ 347
METRIC RANK
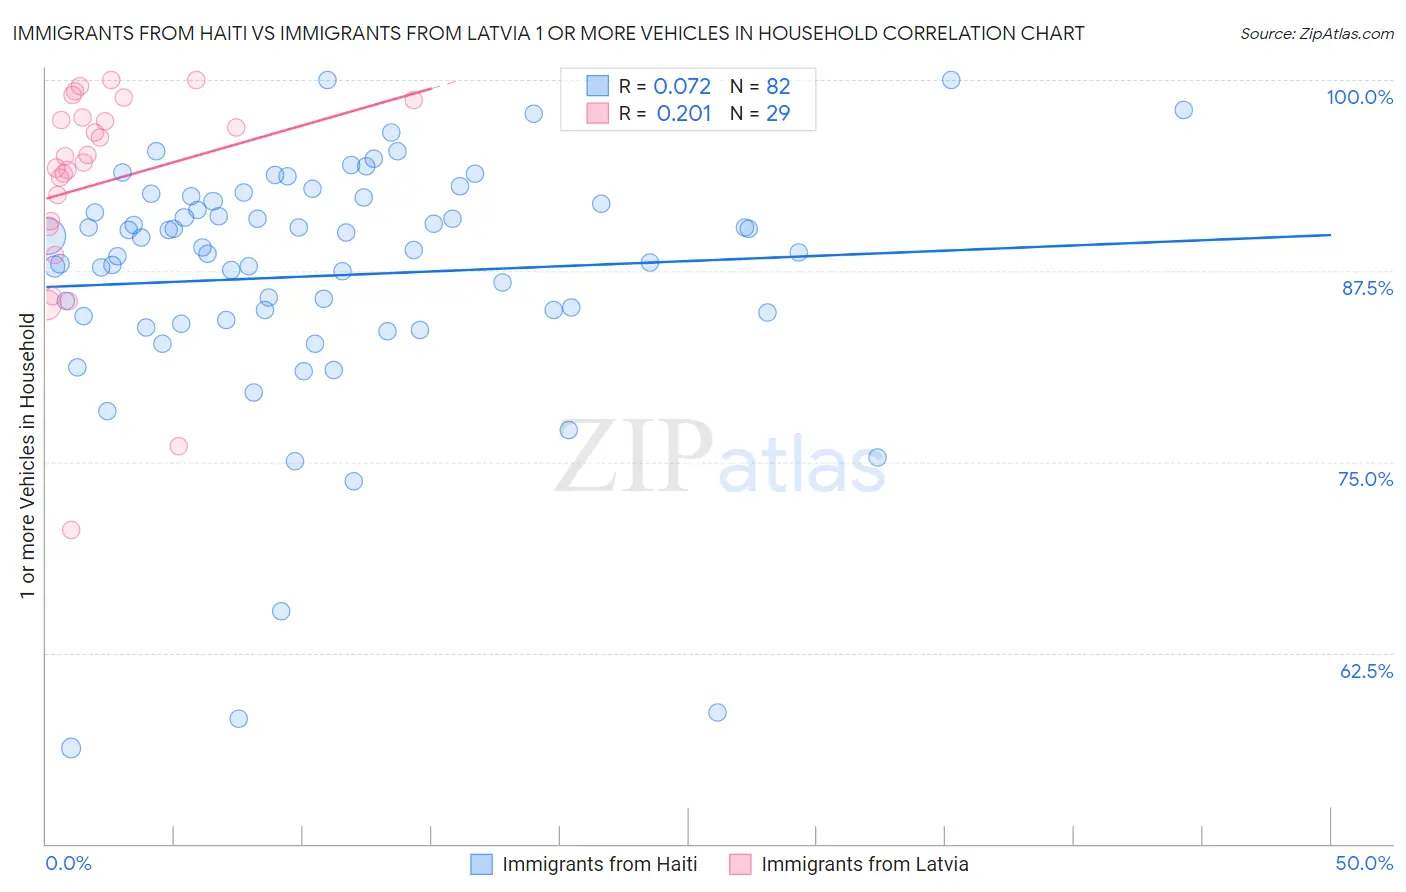
Immigrants from Haiti vs Immigrants from Latvia 1 or more Vehicles in Household Correlation Chart
The statistical analysis conducted on geographies consisting of 225,185,798 people shows a slight positive correlation between the proportion of Immigrants from Haiti and percentage of households with 1 or more vehicles available in the United States with a correlation coefficient (R) of 0.072 and weighted average of 84.7%. Similarly, the statistical analysis conducted on geographies consisting of 113,728,237 people shows a weak positive correlation between the proportion of Immigrants from Latvia and percentage of households with 1 or more vehicles available in the United States with a correlation coefficient (R) of 0.201 and weighted average of 88.1%, a difference of 4.0%.
1 or more Vehicles in Household Correlation Summary
| Measurement | Immigrants from Haiti | Immigrants from Latvia |
| Minimum | 56.3% | 70.5% |
| Maximum | 100.0% | 100.0% |
| Range | 43.7% | 29.5% |
| Mean | 87.2% | 93.2% |
| Median | 88.9% | 95.0% |
| Interquartile 25% (IQ1) | 84.5% | 90.6% |
| Interquartile 75% (IQ3) | 92.1% | 98.1% |
| Interquartile Range (IQR) | 7.5% | 7.5% |
| Standard Deviation (Sample) | 8.3% | 7.0% |
| Standard Deviation (Population) | 8.3% | 6.9% |
Similar Demographics by 1 or more Vehicles in Household
Demographics Similar to Immigrants from Haiti by 1 or more Vehicles in Household
In terms of 1 or more vehicles in household, the demographic groups most similar to Immigrants from Haiti are Immigrants from Belize (84.7%, a difference of 0.010%), U.S. Virgin Islander (84.6%, a difference of 0.030%), Tohono O'odham (84.7%, a difference of 0.040%), Puerto Rican (84.6%, a difference of 0.070%), and Cape Verdean (84.5%, a difference of 0.18%).
| Demographics | Rating | Rank | 1 or more Vehicles in Household |
| Moroccans | 0.0 /100 | #302 | Tragic 85.4% |
| Immigrants | Greece | 0.0 /100 | #303 | Tragic 85.4% |
| Immigrants | Ukraine | 0.0 /100 | #304 | Tragic 85.2% |
| Immigrants | China | 0.0 /100 | #305 | Tragic 84.9% |
| Immigrants | Western Africa | 0.0 /100 | #306 | Tragic 84.9% |
| Tohono O'odham | 0.0 /100 | #307 | Tragic 84.7% |
| Immigrants | Belize | 0.0 /100 | #308 | Tragic 84.7% |
| Immigrants | Haiti | 0.0 /100 | #309 | Tragic 84.7% |
| U.S. Virgin Islanders | 0.0 /100 | #310 | Tragic 84.6% |
| Puerto Ricans | 0.0 /100 | #311 | Tragic 84.6% |
| Cape Verdeans | 0.0 /100 | #312 | Tragic 84.5% |
| Immigrants | Israel | 0.0 /100 | #313 | Tragic 84.5% |
| Albanians | 0.0 /100 | #314 | Tragic 84.4% |
| Cypriots | 0.0 /100 | #315 | Tragic 84.4% |
| Alaska Natives | 0.0 /100 | #316 | Tragic 83.8% |
Demographics Similar to Immigrants from Latvia by 1 or more Vehicles in Household
In terms of 1 or more vehicles in household, the demographic groups most similar to Immigrants from Latvia are Colombian (88.0%, a difference of 0.010%), Liberian (88.0%, a difference of 0.010%), South American Indian (88.0%, a difference of 0.010%), Haitian (88.1%, a difference of 0.020%), and Honduran (88.1%, a difference of 0.030%).
| Demographics | Rating | Rank | 1 or more Vehicles in Household |
| Immigrants | Nigeria | 1.5 /100 | #248 | Tragic 88.2% |
| Blacks/African Americans | 1.4 /100 | #249 | Tragic 88.2% |
| Egyptians | 1.2 /100 | #250 | Tragic 88.2% |
| Immigrants | Serbia | 1.2 /100 | #251 | Tragic 88.2% |
| Immigrants | Uruguay | 1.1 /100 | #252 | Tragic 88.1% |
| Hondurans | 1.0 /100 | #253 | Tragic 88.1% |
| Haitians | 0.9 /100 | #254 | Tragic 88.1% |
| Immigrants | Latvia | 0.9 /100 | #255 | Tragic 88.1% |
| Colombians | 0.9 /100 | #256 | Tragic 88.0% |
| Liberians | 0.9 /100 | #257 | Tragic 88.0% |
| South American Indians | 0.9 /100 | #258 | Tragic 88.0% |
| Nigerians | 0.8 /100 | #259 | Tragic 88.0% |
| Macedonians | 0.6 /100 | #260 | Tragic 87.9% |
| Immigrants | Switzerland | 0.6 /100 | #261 | Tragic 87.9% |
| Sub-Saharan Africans | 0.5 /100 | #262 | Tragic 87.9% |