Inupiat vs Immigrants from Korea Unemployment Among Women with Children Under 18 years
COMPARE
Inupiat
Immigrants from Korea
Unemployment Among Women with Children Under 18 years
Unemployment Among Women with Children Under 18 years Comparison
Inupiat
Immigrants from Korea
9.6%
UNEMPLOYMENT AMONG WOMEN WITH CHILDREN UNDER 18 YEARS
0.0/ 100
METRIC RATING
344th/ 347
METRIC RANK
5.0%
UNEMPLOYMENT AMONG WOMEN WITH CHILDREN UNDER 18 YEARS
98.7/ 100
METRIC RATING
46th/ 347
METRIC RANK
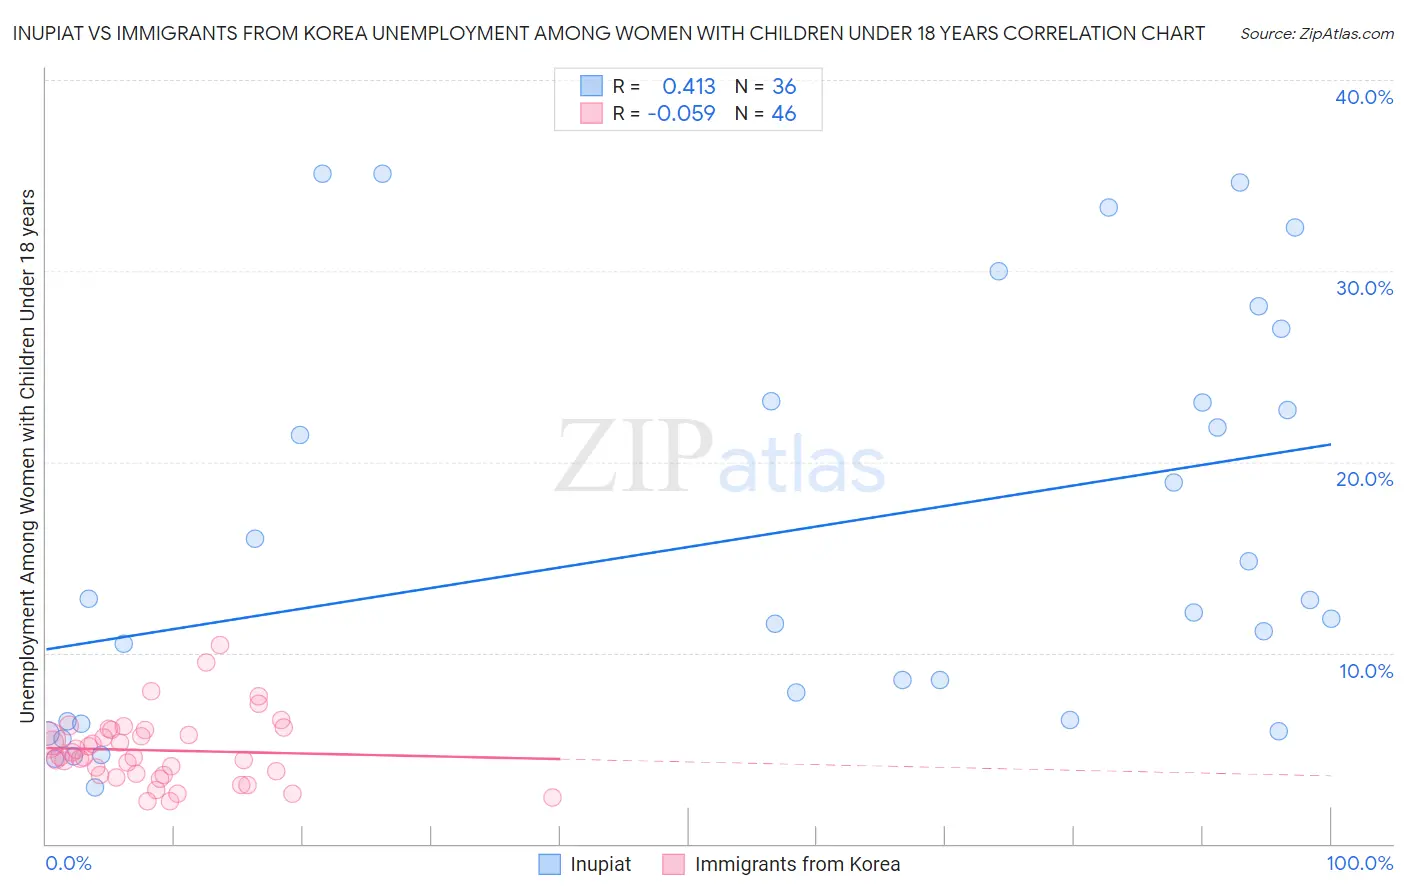
Inupiat vs Immigrants from Korea Unemployment Among Women with Children Under 18 years Correlation Chart
The statistical analysis conducted on geographies consisting of 94,720,534 people shows a moderate positive correlation between the proportion of Inupiat and unemployment rate among women with children under the age of 18 in the United States with a correlation coefficient (R) of 0.413 and weighted average of 9.6%. Similarly, the statistical analysis conducted on geographies consisting of 398,833,856 people shows a slight negative correlation between the proportion of Immigrants from Korea and unemployment rate among women with children under the age of 18 in the United States with a correlation coefficient (R) of -0.059 and weighted average of 5.0%, a difference of 90.7%.
Unemployment Among Women with Children Under 18 years Correlation Summary
| Measurement | Inupiat | Immigrants from Korea |
| Minimum | 2.9% | 2.2% |
| Maximum | 35.1% | 10.4% |
| Range | 32.2% | 8.2% |
| Mean | 16.1% | 4.9% |
| Median | 12.4% | 4.5% |
| Interquartile 25% (IQ1) | 6.5% | 3.6% |
| Interquartile 75% (IQ3) | 23.1% | 5.9% |
| Interquartile Range (IQR) | 16.7% | 2.3% |
| Standard Deviation (Sample) | 10.4% | 1.8% |
| Standard Deviation (Population) | 10.3% | 1.8% |
Similar Demographics by Unemployment Among Women with Children Under 18 years
Demographics Similar to Inupiat by Unemployment Among Women with Children Under 18 years
In terms of unemployment among women with children under 18 years, the demographic groups most similar to Inupiat are Yuman (9.8%, a difference of 1.9%), Arapaho (9.2%, a difference of 4.2%), Puerto Rican (9.0%, a difference of 6.4%), Tohono O'odham (8.9%, a difference of 8.1%), and Yup'ik (11.0%, a difference of 15.1%).
| Demographics | Rating | Rank | Unemployment Among Women with Children Under 18 years |
| Immigrants | Dominican Republic | 0.0 /100 | #333 | Tragic 7.5% |
| Cheyenne | 0.0 /100 | #334 | Tragic 7.8% |
| Apache | 0.0 /100 | #335 | Tragic 7.9% |
| Sioux | 0.0 /100 | #336 | Tragic 7.9% |
| Yakama | 0.0 /100 | #337 | Tragic 8.1% |
| Immigrants | Yemen | 0.0 /100 | #338 | Tragic 8.2% |
| Navajo | 0.0 /100 | #339 | Tragic 8.2% |
| Crow | 0.0 /100 | #340 | Tragic 8.2% |
| Tohono O'odham | 0.0 /100 | #341 | Tragic 8.9% |
| Puerto Ricans | 0.0 /100 | #342 | Tragic 9.0% |
| Arapaho | 0.0 /100 | #343 | Tragic 9.2% |
| Inupiat | 0.0 /100 | #344 | Tragic 9.6% |
| Yuman | 0.0 /100 | #345 | Tragic 9.8% |
| Yup'ik | 0.0 /100 | #346 | Tragic 11.0% |
| Pima | 0.0 /100 | #347 | Tragic 11.7% |
Demographics Similar to Immigrants from Korea by Unemployment Among Women with Children Under 18 years
In terms of unemployment among women with children under 18 years, the demographic groups most similar to Immigrants from Korea are Immigrants from Malaysia (5.0%, a difference of 0.11%), British (5.0%, a difference of 0.13%), Immigrants from Moldova (5.0%, a difference of 0.20%), Northern European (5.0%, a difference of 0.25%), and Turkish (5.0%, a difference of 0.26%).
| Demographics | Rating | Rank | Unemployment Among Women with Children Under 18 years |
| English | 99.1 /100 | #39 | Exceptional 5.0% |
| Greeks | 99.0 /100 | #40 | Exceptional 5.0% |
| Immigrants | Bosnia and Herzegovina | 99.0 /100 | #41 | Exceptional 5.0% |
| Eastern Europeans | 98.9 /100 | #42 | Exceptional 5.0% |
| Turks | 98.9 /100 | #43 | Exceptional 5.0% |
| Immigrants | Moldova | 98.9 /100 | #44 | Exceptional 5.0% |
| Immigrants | Malaysia | 98.8 /100 | #45 | Exceptional 5.0% |
| Immigrants | Korea | 98.7 /100 | #46 | Exceptional 5.0% |
| British | 98.7 /100 | #47 | Exceptional 5.0% |
| Northern Europeans | 98.6 /100 | #48 | Exceptional 5.0% |
| Lithuanians | 98.4 /100 | #49 | Exceptional 5.0% |
| Immigrants | Japan | 98.4 /100 | #50 | Exceptional 5.0% |
| Yugoslavians | 98.3 /100 | #51 | Exceptional 5.1% |
| Immigrants | Nepal | 98.3 /100 | #52 | Exceptional 5.1% |
| Scottish | 98.2 /100 | #53 | Exceptional 5.1% |