Indian (Asian) vs Zimbabwean 1 or more Vehicles in Household
COMPARE
Indian (Asian)
Zimbabwean
1 or more Vehicles in Household
1 or more Vehicles in Household Comparison
Indians (Asian)
Zimbabweans
86.0%
1 OR MORE VEHICLES IN HOUSEHOLD
0.0/ 100
METRIC RATING
293rd/ 347
METRIC RANK
91.0%
1 OR MORE VEHICLES IN HOUSEHOLD
97.7/ 100
METRIC RATING
106th/ 347
METRIC RANK
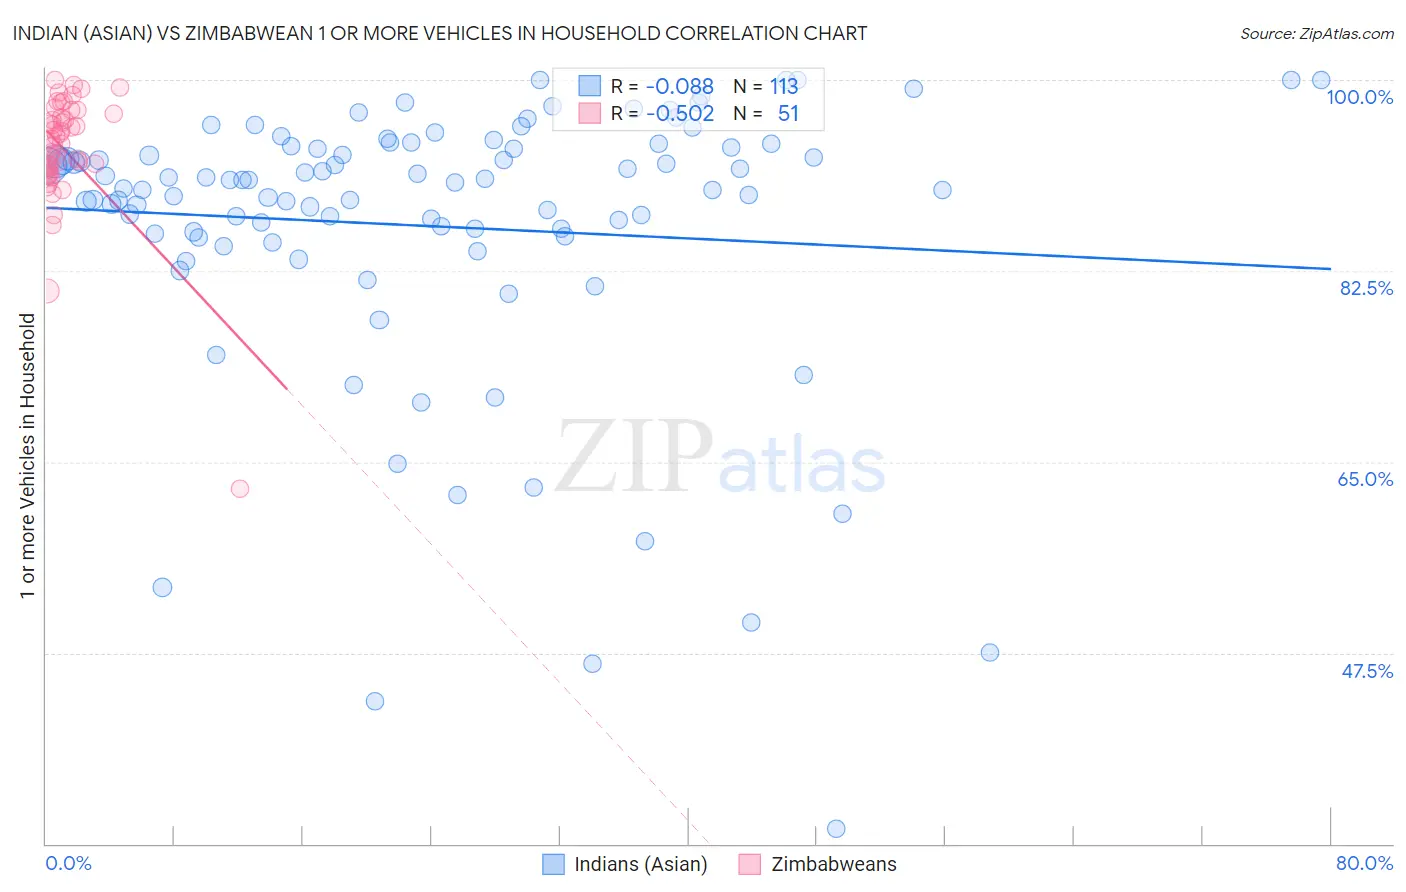
Indian (Asian) vs Zimbabwean 1 or more Vehicles in Household Correlation Chart
The statistical analysis conducted on geographies consisting of 494,856,694 people shows a slight negative correlation between the proportion of Indians (Asian) and percentage of households with 1 or more vehicles available in the United States with a correlation coefficient (R) of -0.088 and weighted average of 86.0%. Similarly, the statistical analysis conducted on geographies consisting of 69,192,017 people shows a substantial negative correlation between the proportion of Zimbabweans and percentage of households with 1 or more vehicles available in the United States with a correlation coefficient (R) of -0.502 and weighted average of 91.0%, a difference of 5.8%.
1 or more Vehicles in Household Correlation Summary
| Measurement | Indian (Asian) | Zimbabwean |
| Minimum | 31.4% | 62.5% |
| Maximum | 100.0% | 100.0% |
| Range | 68.6% | 37.5% |
| Mean | 86.6% | 93.6% |
| Median | 90.6% | 94.6% |
| Interquartile 25% (IQ1) | 85.8% | 91.9% |
| Interquartile 75% (IQ3) | 93.9% | 96.9% |
| Interquartile Range (IQR) | 8.1% | 5.0% |
| Standard Deviation (Sample) | 13.0% | 5.8% |
| Standard Deviation (Population) | 13.0% | 5.7% |
Similar Demographics by 1 or more Vehicles in Household
Demographics Similar to Indians (Asian) by 1 or more Vehicles in Household
In terms of 1 or more vehicles in household, the demographic groups most similar to Indians (Asian) are Okinawan (86.1%, a difference of 0.060%), Alaskan Athabascan (86.0%, a difference of 0.070%), Immigrants from Jamaica (85.8%, a difference of 0.24%), Immigrants from Spain (85.8%, a difference of 0.28%), and Pima (86.3%, a difference of 0.29%).
| Demographics | Rating | Rank | 1 or more Vehicles in Household |
| Immigrants | Eastern Asia | 0.0 /100 | #286 | Tragic 86.5% |
| Immigrants | Malaysia | 0.0 /100 | #287 | Tragic 86.5% |
| Hopi | 0.0 /100 | #288 | Tragic 86.4% |
| Immigrants | Ireland | 0.0 /100 | #289 | Tragic 86.4% |
| Immigrants | Australia | 0.0 /100 | #290 | Tragic 86.4% |
| Pima | 0.0 /100 | #291 | Tragic 86.3% |
| Okinawans | 0.0 /100 | #292 | Tragic 86.1% |
| Indians (Asian) | 0.0 /100 | #293 | Tragic 86.0% |
| Alaskan Athabascans | 0.0 /100 | #294 | Tragic 86.0% |
| Immigrants | Jamaica | 0.0 /100 | #295 | Tragic 85.8% |
| Immigrants | Spain | 0.0 /100 | #296 | Tragic 85.8% |
| Paraguayans | 0.0 /100 | #297 | Tragic 85.7% |
| Belizeans | 0.0 /100 | #298 | Tragic 85.7% |
| Yuman | 0.0 /100 | #299 | Tragic 85.5% |
| Immigrants | Russia | 0.0 /100 | #300 | Tragic 85.4% |
Demographics Similar to Zimbabweans by 1 or more Vehicles in Household
In terms of 1 or more vehicles in household, the demographic groups most similar to Zimbabweans are Maltese (91.0%, a difference of 0.020%), Hispanic or Latino (91.0%, a difference of 0.020%), Delaware (91.0%, a difference of 0.020%), Laotian (91.0%, a difference of 0.040%), and Mexican American Indian (91.0%, a difference of 0.050%).
| Demographics | Rating | Rank | 1 or more Vehicles in Household |
| Immigrants | Bolivia | 98.6 /100 | #99 | Exceptional 91.2% |
| Immigrants | Central America | 98.4 /100 | #100 | Exceptional 91.1% |
| Bulgarians | 98.4 /100 | #101 | Exceptional 91.1% |
| Seminole | 98.3 /100 | #102 | Exceptional 91.1% |
| Yugoslavians | 98.3 /100 | #103 | Exceptional 91.1% |
| Asians | 98.2 /100 | #104 | Exceptional 91.1% |
| Laotians | 98.0 /100 | #105 | Exceptional 91.0% |
| Zimbabweans | 97.7 /100 | #106 | Exceptional 91.0% |
| Maltese | 97.7 /100 | #107 | Exceptional 91.0% |
| Hispanics or Latinos | 97.6 /100 | #108 | Exceptional 91.0% |
| Delaware | 97.6 /100 | #109 | Exceptional 91.0% |
| Mexican American Indians | 97.4 /100 | #110 | Exceptional 91.0% |
| Navajo | 95.8 /100 | #111 | Exceptional 90.8% |
| Immigrants | Netherlands | 95.7 /100 | #112 | Exceptional 90.8% |
| Immigrants | Kuwait | 94.7 /100 | #113 | Exceptional 90.7% |