Indian (Asian) vs Scotch-Irish 1 or more Vehicles in Household
COMPARE
Indian (Asian)
Scotch-Irish
1 or more Vehicles in Household
1 or more Vehicles in Household Comparison
Indians (Asian)
Scotch-Irish
86.0%
1 OR MORE VEHICLES IN HOUSEHOLD
0.0/ 100
METRIC RATING
293rd/ 347
METRIC RANK
93.3%
1 OR MORE VEHICLES IN HOUSEHOLD
100.0/ 100
METRIC RATING
9th/ 347
METRIC RANK
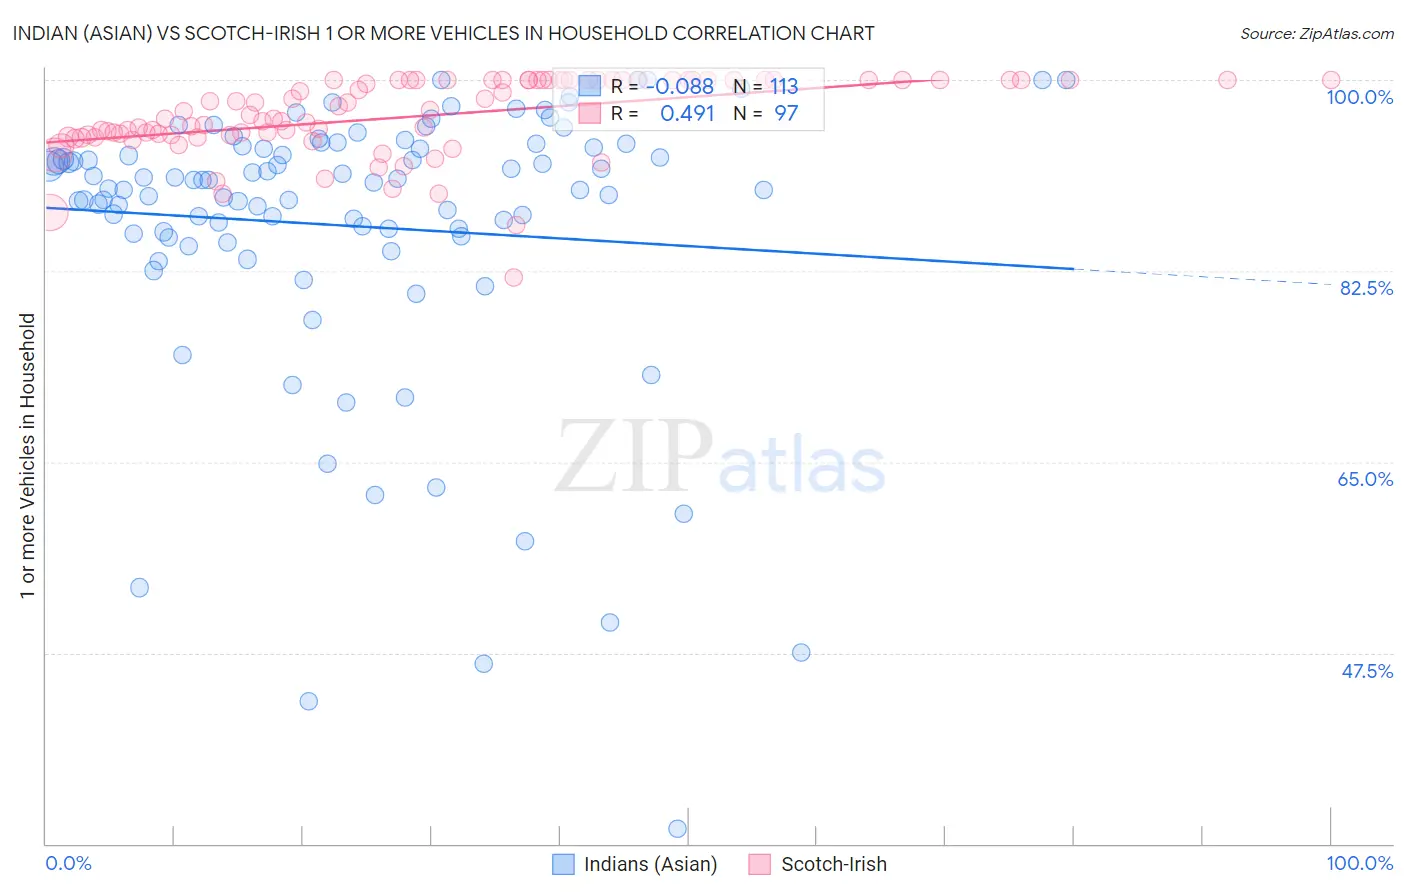
Indian (Asian) vs Scotch-Irish 1 or more Vehicles in Household Correlation Chart
The statistical analysis conducted on geographies consisting of 494,856,694 people shows a slight negative correlation between the proportion of Indians (Asian) and percentage of households with 1 or more vehicles available in the United States with a correlation coefficient (R) of -0.088 and weighted average of 86.0%. Similarly, the statistical analysis conducted on geographies consisting of 548,450,125 people shows a moderate positive correlation between the proportion of Scotch-Irish and percentage of households with 1 or more vehicles available in the United States with a correlation coefficient (R) of 0.491 and weighted average of 93.3%, a difference of 8.5%.
1 or more Vehicles in Household Correlation Summary
| Measurement | Indian (Asian) | Scotch-Irish |
| Minimum | 31.4% | 81.9% |
| Maximum | 100.0% | 100.0% |
| Range | 68.6% | 18.1% |
| Mean | 86.6% | 96.6% |
| Median | 90.6% | 96.8% |
| Interquartile 25% (IQ1) | 85.8% | 94.9% |
| Interquartile 75% (IQ3) | 93.9% | 100.0% |
| Interquartile Range (IQR) | 8.1% | 5.1% |
| Standard Deviation (Sample) | 13.0% | 3.6% |
| Standard Deviation (Population) | 13.0% | 3.6% |
Similar Demographics by 1 or more Vehicles in Household
Demographics Similar to Indians (Asian) by 1 or more Vehicles in Household
In terms of 1 or more vehicles in household, the demographic groups most similar to Indians (Asian) are Okinawan (86.1%, a difference of 0.060%), Alaskan Athabascan (86.0%, a difference of 0.070%), Immigrants from Jamaica (85.8%, a difference of 0.24%), Immigrants from Spain (85.8%, a difference of 0.28%), and Pima (86.3%, a difference of 0.29%).
| Demographics | Rating | Rank | 1 or more Vehicles in Household |
| Immigrants | Eastern Asia | 0.0 /100 | #286 | Tragic 86.5% |
| Immigrants | Malaysia | 0.0 /100 | #287 | Tragic 86.5% |
| Hopi | 0.0 /100 | #288 | Tragic 86.4% |
| Immigrants | Ireland | 0.0 /100 | #289 | Tragic 86.4% |
| Immigrants | Australia | 0.0 /100 | #290 | Tragic 86.4% |
| Pima | 0.0 /100 | #291 | Tragic 86.3% |
| Okinawans | 0.0 /100 | #292 | Tragic 86.1% |
| Indians (Asian) | 0.0 /100 | #293 | Tragic 86.0% |
| Alaskan Athabascans | 0.0 /100 | #294 | Tragic 86.0% |
| Immigrants | Jamaica | 0.0 /100 | #295 | Tragic 85.8% |
| Immigrants | Spain | 0.0 /100 | #296 | Tragic 85.8% |
| Paraguayans | 0.0 /100 | #297 | Tragic 85.7% |
| Belizeans | 0.0 /100 | #298 | Tragic 85.7% |
| Yuman | 0.0 /100 | #299 | Tragic 85.5% |
| Immigrants | Russia | 0.0 /100 | #300 | Tragic 85.4% |
Demographics Similar to Scotch-Irish by 1 or more Vehicles in Household
In terms of 1 or more vehicles in household, the demographic groups most similar to Scotch-Irish are Swedish (93.3%, a difference of 0.010%), Dutch (93.3%, a difference of 0.030%), Scottish (93.4%, a difference of 0.060%), Czech (93.3%, a difference of 0.060%), and Scandinavian (93.1%, a difference of 0.21%).
| Demographics | Rating | Rank | 1 or more Vehicles in Household |
| English | 100.0 /100 | #2 | Exceptional 93.8% |
| Norwegians | 100.0 /100 | #3 | Exceptional 93.7% |
| Germans | 100.0 /100 | #4 | Exceptional 93.6% |
| Yakama | 100.0 /100 | #5 | Exceptional 93.6% |
| Danes | 100.0 /100 | #6 | Exceptional 93.5% |
| Scottish | 100.0 /100 | #7 | Exceptional 93.4% |
| Swedes | 100.0 /100 | #8 | Exceptional 93.3% |
| Scotch-Irish | 100.0 /100 | #9 | Exceptional 93.3% |
| Dutch | 100.0 /100 | #10 | Exceptional 93.3% |
| Czechs | 100.0 /100 | #11 | Exceptional 93.3% |
| Scandinavians | 100.0 /100 | #12 | Exceptional 93.1% |
| Whites/Caucasians | 100.0 /100 | #13 | Exceptional 93.1% |
| Irish | 100.0 /100 | #14 | Exceptional 93.1% |
| Mexicans | 100.0 /100 | #15 | Exceptional 93.0% |
| Assyrians/Chaldeans/Syriacs | 100.0 /100 | #16 | Exceptional 93.0% |