Indian (Asian) vs West Indian 1 or more Vehicles in Household
COMPARE
Indian (Asian)
West Indian
1 or more Vehicles in Household
1 or more Vehicles in Household Comparison
Indians (Asian)
West Indians
86.0%
1 OR MORE VEHICLES IN HOUSEHOLD
0.0/ 100
METRIC RATING
293rd/ 347
METRIC RANK
76.4%
1 OR MORE VEHICLES IN HOUSEHOLD
0.0/ 100
METRIC RATING
331st/ 347
METRIC RANK
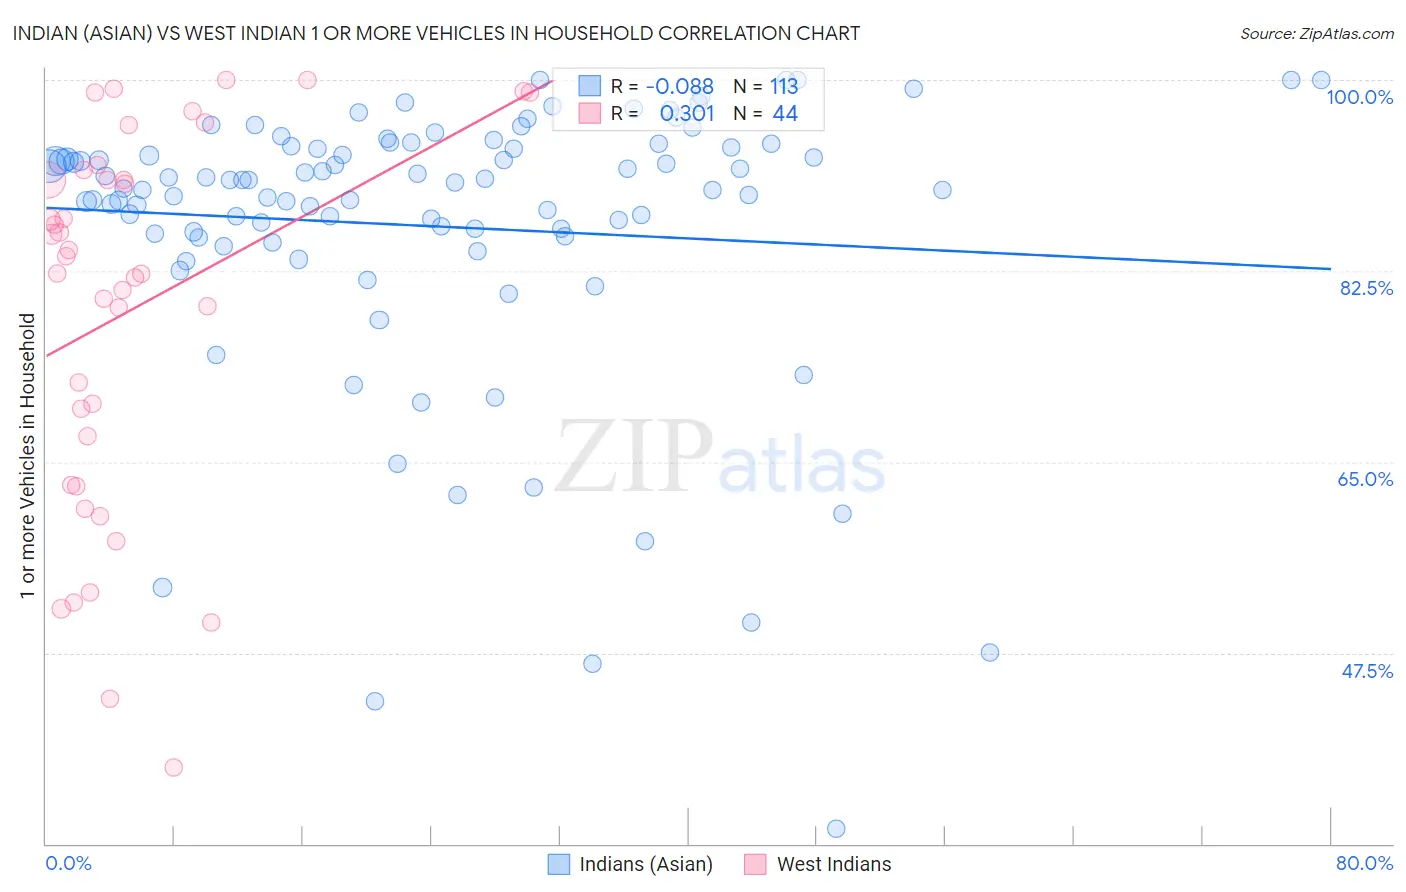
Indian (Asian) vs West Indian 1 or more Vehicles in Household Correlation Chart
The statistical analysis conducted on geographies consisting of 494,856,694 people shows a slight negative correlation between the proportion of Indians (Asian) and percentage of households with 1 or more vehicles available in the United States with a correlation coefficient (R) of -0.088 and weighted average of 86.0%. Similarly, the statistical analysis conducted on geographies consisting of 253,892,207 people shows a mild positive correlation between the proportion of West Indians and percentage of households with 1 or more vehicles available in the United States with a correlation coefficient (R) of 0.301 and weighted average of 76.4%, a difference of 12.7%.
1 or more Vehicles in Household Correlation Summary
| Measurement | Indian (Asian) | West Indian |
| Minimum | 31.4% | 37.0% |
| Maximum | 100.0% | 100.0% |
| Range | 68.6% | 63.0% |
| Mean | 86.6% | 78.9% |
| Median | 90.6% | 83.1% |
| Interquartile 25% (IQ1) | 85.8% | 65.1% |
| Interquartile 75% (IQ3) | 93.9% | 91.3% |
| Interquartile Range (IQR) | 8.1% | 26.2% |
| Standard Deviation (Sample) | 13.0% | 17.2% |
| Standard Deviation (Population) | 13.0% | 17.0% |
Similar Demographics by 1 or more Vehicles in Household
Demographics Similar to Indians (Asian) by 1 or more Vehicles in Household
In terms of 1 or more vehicles in household, the demographic groups most similar to Indians (Asian) are Okinawan (86.1%, a difference of 0.060%), Alaskan Athabascan (86.0%, a difference of 0.070%), Immigrants from Jamaica (85.8%, a difference of 0.24%), Immigrants from Spain (85.8%, a difference of 0.28%), and Pima (86.3%, a difference of 0.29%).
| Demographics | Rating | Rank | 1 or more Vehicles in Household |
| Immigrants | Eastern Asia | 0.0 /100 | #286 | Tragic 86.5% |
| Immigrants | Malaysia | 0.0 /100 | #287 | Tragic 86.5% |
| Hopi | 0.0 /100 | #288 | Tragic 86.4% |
| Immigrants | Ireland | 0.0 /100 | #289 | Tragic 86.4% |
| Immigrants | Australia | 0.0 /100 | #290 | Tragic 86.4% |
| Pima | 0.0 /100 | #291 | Tragic 86.3% |
| Okinawans | 0.0 /100 | #292 | Tragic 86.1% |
| Indians (Asian) | 0.0 /100 | #293 | Tragic 86.0% |
| Alaskan Athabascans | 0.0 /100 | #294 | Tragic 86.0% |
| Immigrants | Jamaica | 0.0 /100 | #295 | Tragic 85.8% |
| Immigrants | Spain | 0.0 /100 | #296 | Tragic 85.8% |
| Paraguayans | 0.0 /100 | #297 | Tragic 85.7% |
| Belizeans | 0.0 /100 | #298 | Tragic 85.7% |
| Yuman | 0.0 /100 | #299 | Tragic 85.5% |
| Immigrants | Russia | 0.0 /100 | #300 | Tragic 85.4% |
Demographics Similar to West Indians by 1 or more Vehicles in Household
In terms of 1 or more vehicles in household, the demographic groups most similar to West Indians are Trinidadian and Tobagonian (76.3%, a difference of 0.080%), Immigrants from Ecuador (76.2%, a difference of 0.18%), Immigrants from Trinidad and Tobago (76.8%, a difference of 0.55%), Immigrants from Dominica (77.8%, a difference of 1.9%), and Ecuadorian (77.9%, a difference of 2.1%).
| Demographics | Rating | Rank | 1 or more Vehicles in Household |
| Immigrants | Caribbean | 0.0 /100 | #324 | Tragic 80.4% |
| Senegalese | 0.0 /100 | #325 | Tragic 80.4% |
| Immigrants | West Indies | 0.0 /100 | #326 | Tragic 79.5% |
| Immigrants | Senegal | 0.0 /100 | #327 | Tragic 79.0% |
| Ecuadorians | 0.0 /100 | #328 | Tragic 77.9% |
| Immigrants | Dominica | 0.0 /100 | #329 | Tragic 77.8% |
| Immigrants | Trinidad and Tobago | 0.0 /100 | #330 | Tragic 76.8% |
| West Indians | 0.0 /100 | #331 | Tragic 76.4% |
| Trinidadians and Tobagonians | 0.0 /100 | #332 | Tragic 76.3% |
| Immigrants | Ecuador | 0.0 /100 | #333 | Tragic 76.2% |
| Immigrants | Bangladesh | 0.0 /100 | #334 | Tragic 74.3% |
| Barbadians | 0.0 /100 | #335 | Tragic 74.0% |
| Vietnamese | 0.0 /100 | #336 | Tragic 73.8% |
| Immigrants | Uzbekistan | 0.0 /100 | #337 | Tragic 73.4% |
| Inupiat | 0.0 /100 | #338 | Tragic 71.5% |