Indian (Asian) vs Zimbabwean Cognitive Disability
COMPARE
Indian (Asian)
Zimbabwean
Cognitive Disability
Cognitive Disability Comparison
Indians (Asian)
Zimbabweans
16.8%
COGNITIVE DISABILITY
97.2/ 100
METRIC RATING
112th/ 347
METRIC RANK
17.6%
COGNITIVE DISABILITY
6.1/ 100
METRIC RATING
220th/ 347
METRIC RANK
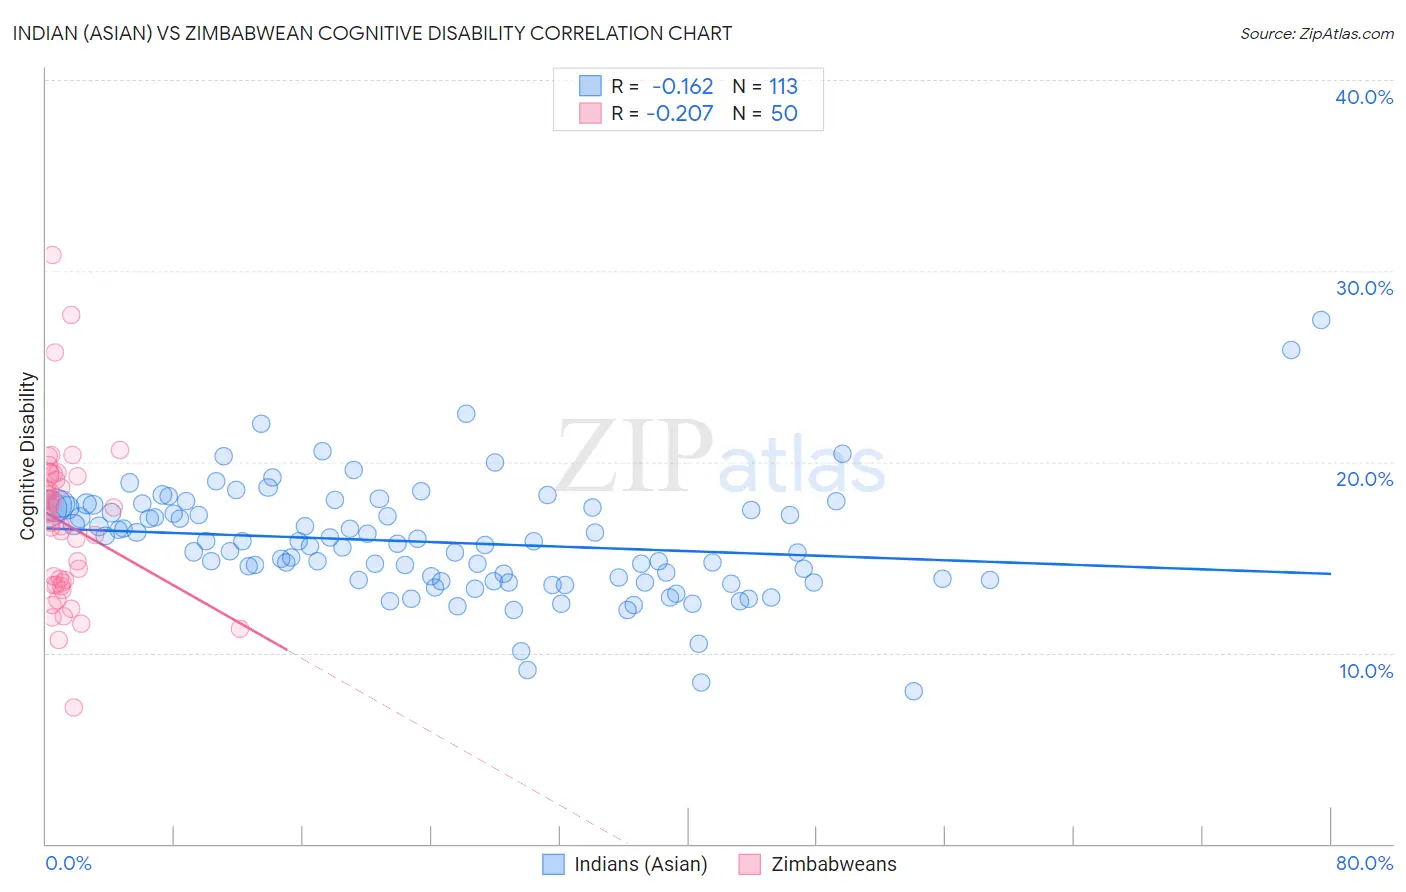
Indian (Asian) vs Zimbabwean Cognitive Disability Correlation Chart
The statistical analysis conducted on geographies consisting of 495,263,567 people shows a poor negative correlation between the proportion of Indians (Asian) and percentage of population with cognitive disability in the United States with a correlation coefficient (R) of -0.162 and weighted average of 16.8%. Similarly, the statistical analysis conducted on geographies consisting of 69,204,510 people shows a weak negative correlation between the proportion of Zimbabweans and percentage of population with cognitive disability in the United States with a correlation coefficient (R) of -0.207 and weighted average of 17.6%, a difference of 4.6%.
Cognitive Disability Correlation Summary
| Measurement | Indian (Asian) | Zimbabwean |
| Minimum | 8.0% | 7.2% |
| Maximum | 27.5% | 30.8% |
| Range | 19.5% | 23.7% |
| Mean | 15.8% | 16.8% |
| Median | 15.7% | 17.1% |
| Interquartile 25% (IQ1) | 13.8% | 13.6% |
| Interquartile 75% (IQ3) | 17.6% | 19.2% |
| Interquartile Range (IQR) | 3.8% | 5.6% |
| Standard Deviation (Sample) | 3.0% | 4.3% |
| Standard Deviation (Population) | 3.0% | 4.2% |
Similar Demographics by Cognitive Disability
Demographics Similar to Indians (Asian) by Cognitive Disability
In terms of cognitive disability, the demographic groups most similar to Indians (Asian) are Immigrants from Sri Lanka (16.8%, a difference of 0.0%), Korean (16.8%, a difference of 0.010%), Uruguayan (16.8%, a difference of 0.020%), Albanian (16.8%, a difference of 0.040%), and Arapaho (16.8%, a difference of 0.040%).
| Demographics | Rating | Rank | Cognitive Disability |
| Immigrants | Eastern Asia | 97.9 /100 | #105 | Exceptional 16.8% |
| Northern Europeans | 97.8 /100 | #106 | Exceptional 16.8% |
| Immigrants | Nicaragua | 97.8 /100 | #107 | Exceptional 16.8% |
| Canadians | 97.5 /100 | #108 | Exceptional 16.8% |
| Albanians | 97.3 /100 | #109 | Exceptional 16.8% |
| Arapaho | 97.3 /100 | #110 | Exceptional 16.8% |
| Uruguayans | 97.2 /100 | #111 | Exceptional 16.8% |
| Indians (Asian) | 97.2 /100 | #112 | Exceptional 16.8% |
| Immigrants | Sri Lanka | 97.1 /100 | #113 | Exceptional 16.8% |
| Koreans | 97.1 /100 | #114 | Exceptional 16.8% |
| Yup'ik | 96.9 /100 | #115 | Exceptional 16.9% |
| Inupiat | 96.5 /100 | #116 | Exceptional 16.9% |
| Immigrants | Japan | 96.2 /100 | #117 | Exceptional 16.9% |
| Immigrants | Denmark | 96.2 /100 | #118 | Exceptional 16.9% |
| South Africans | 95.5 /100 | #119 | Exceptional 16.9% |
Demographics Similar to Zimbabweans by Cognitive Disability
In terms of cognitive disability, the demographic groups most similar to Zimbabweans are Moroccan (17.6%, a difference of 0.020%), Immigrants from Sierra Leone (17.6%, a difference of 0.030%), Icelander (17.6%, a difference of 0.040%), Salvadoran (17.6%, a difference of 0.070%), and Okinawan (17.6%, a difference of 0.090%).
| Demographics | Rating | Rank | Cognitive Disability |
| Hawaiians | 7.2 /100 | #213 | Tragic 17.6% |
| Immigrants | El Salvador | 7.0 /100 | #214 | Tragic 17.6% |
| Alaskan Athabascans | 6.9 /100 | #215 | Tragic 17.6% |
| Okinawans | 6.8 /100 | #216 | Tragic 17.6% |
| Salvadorans | 6.7 /100 | #217 | Tragic 17.6% |
| Icelanders | 6.4 /100 | #218 | Tragic 17.6% |
| Immigrants | Sierra Leone | 6.3 /100 | #219 | Tragic 17.6% |
| Zimbabweans | 6.1 /100 | #220 | Tragic 17.6% |
| Moroccans | 5.9 /100 | #221 | Tragic 17.6% |
| Central Americans | 4.5 /100 | #222 | Tragic 17.7% |
| Alsatians | 4.5 /100 | #223 | Tragic 17.7% |
| Fijians | 3.4 /100 | #224 | Tragic 17.7% |
| Vietnamese | 3.4 /100 | #225 | Tragic 17.7% |
| Marshallese | 2.7 /100 | #226 | Tragic 17.7% |
| Immigrants | St. Vincent and the Grenadines | 2.6 /100 | #227 | Tragic 17.7% |