Comanche vs Immigrants from China No Vehicles in Household
COMPARE
Comanche
Immigrants from China
No Vehicles in Household
No Vehicles in Household Comparison
Comanche
Immigrants from China
10.2%
NO VEHICLES IN HOUSEHOLD
60.8/ 100
METRIC RATING
165th/ 347
METRIC RANK
15.2%
NO VEHICLES IN HOUSEHOLD
0.0/ 100
METRIC RATING
305th/ 347
METRIC RANK
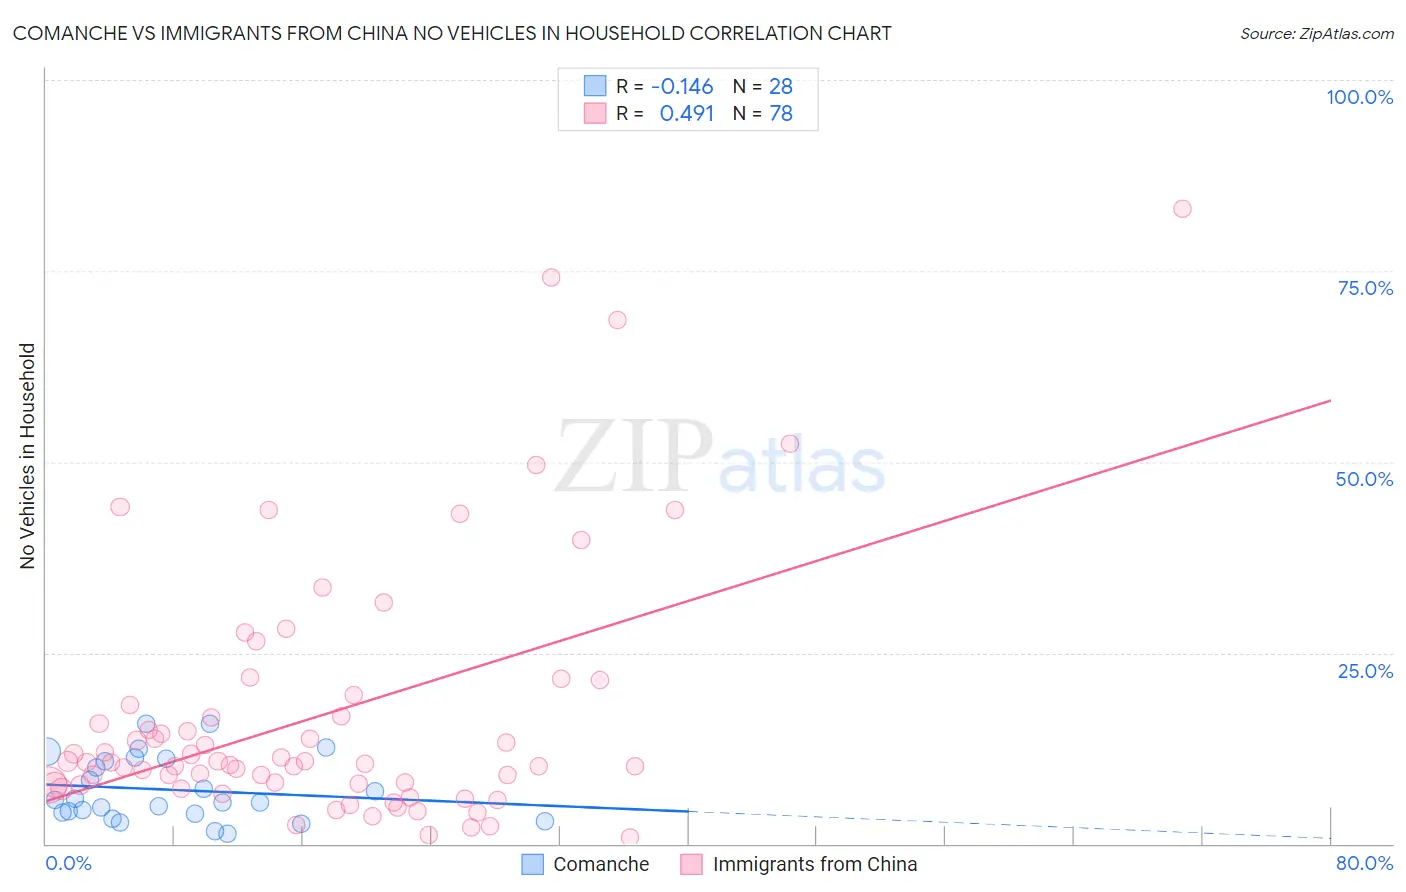
Comanche vs Immigrants from China No Vehicles in Household Correlation Chart
The statistical analysis conducted on geographies consisting of 109,677,271 people shows a poor negative correlation between the proportion of Comanche and percentage of households with no vehicle available in the United States with a correlation coefficient (R) of -0.146 and weighted average of 10.2%. Similarly, the statistical analysis conducted on geographies consisting of 455,244,510 people shows a moderate positive correlation between the proportion of Immigrants from China and percentage of households with no vehicle available in the United States with a correlation coefficient (R) of 0.491 and weighted average of 15.2%, a difference of 47.9%.
No Vehicles in Household Correlation Summary
| Measurement | Comanche | Immigrants from China |
| Minimum | 1.3% | 0.81% |
| Maximum | 15.8% | 83.2% |
| Range | 14.5% | 82.4% |
| Mean | 7.1% | 16.9% |
| Median | 5.6% | 10.7% |
| Interquartile 25% (IQ1) | 4.0% | 7.7% |
| Interquartile 75% (IQ3) | 11.0% | 18.2% |
| Interquartile Range (IQR) | 7.0% | 10.5% |
| Standard Deviation (Sample) | 4.2% | 16.7% |
| Standard Deviation (Population) | 4.1% | 16.6% |
Similar Demographics by No Vehicles in Household
Demographics Similar to Comanche by No Vehicles in Household
In terms of no vehicles in household, the demographic groups most similar to Comanche are South African (10.2%, a difference of 0.040%), Immigrants from Costa Rica (10.3%, a difference of 0.050%), Immigrants from Saudi Arabia (10.3%, a difference of 0.30%), Immigrants from Cambodia (10.2%, a difference of 0.42%), and Immigrants from Austria (10.2%, a difference of 0.52%).
| Demographics | Rating | Rank | No Vehicles in Household |
| Spanish American Indians | 70.2 /100 | #158 | Good 10.1% |
| Immigrants | Indonesia | 69.3 /100 | #159 | Good 10.1% |
| Immigrants | Middle Africa | 65.7 /100 | #160 | Good 10.2% |
| New Zealanders | 65.1 /100 | #161 | Good 10.2% |
| Immigrants | Austria | 64.4 /100 | #162 | Good 10.2% |
| Immigrants | Cambodia | 63.7 /100 | #163 | Good 10.2% |
| South Africans | 61.1 /100 | #164 | Good 10.2% |
| Comanche | 60.8 /100 | #165 | Good 10.2% |
| Immigrants | Costa Rica | 60.5 /100 | #166 | Good 10.3% |
| Immigrants | Saudi Arabia | 58.8 /100 | #167 | Average 10.3% |
| Indonesians | 56.7 /100 | #168 | Average 10.3% |
| Lumbee | 54.7 /100 | #169 | Average 10.3% |
| Immigrants | Latin America | 53.2 /100 | #170 | Average 10.4% |
| Hmong | 52.7 /100 | #171 | Average 10.4% |
| Brazilians | 51.7 /100 | #172 | Average 10.4% |
Demographics Similar to Immigrants from China by No Vehicles in Household
In terms of no vehicles in household, the demographic groups most similar to Immigrants from China are Immigrants from Russia (15.1%, a difference of 0.38%), Immigrants from Western Africa (15.0%, a difference of 1.0%), Immigrants from Belize (15.4%, a difference of 1.3%), Immigrants from Haiti (15.4%, a difference of 1.5%), and U.S. Virgin Islander (15.4%, a difference of 1.5%).
| Demographics | Rating | Rank | No Vehicles in Household |
| Moroccans | 0.0 /100 | #298 | Tragic 14.7% |
| Immigrants | Greece | 0.0 /100 | #299 | Tragic 14.7% |
| Yuman | 0.0 /100 | #300 | Tragic 14.9% |
| Immigrants | Ukraine | 0.0 /100 | #301 | Tragic 14.9% |
| Haitians | 0.0 /100 | #302 | Tragic 14.9% |
| Immigrants | Western Africa | 0.0 /100 | #303 | Tragic 15.0% |
| Immigrants | Russia | 0.0 /100 | #304 | Tragic 15.1% |
| Immigrants | China | 0.0 /100 | #305 | Tragic 15.2% |
| Immigrants | Belize | 0.0 /100 | #306 | Tragic 15.4% |
| Immigrants | Haiti | 0.0 /100 | #307 | Tragic 15.4% |
| U.S. Virgin Islanders | 0.0 /100 | #308 | Tragic 15.4% |
| Puerto Ricans | 0.0 /100 | #309 | Tragic 15.5% |
| Cape Verdeans | 0.0 /100 | #310 | Tragic 15.6% |
| Immigrants | Israel | 0.0 /100 | #311 | Tragic 15.6% |
| Alaskan Athabascans | 0.0 /100 | #312 | Tragic 15.6% |