Immigrants from Venezuela vs Thai 2 or more Vehicles in Household
COMPARE
Immigrants from Venezuela
Thai
2 or more Vehicles in Household
2 or more Vehicles in Household Comparison
Immigrants from Venezuela
Thais
55.8%
2 OR MORE VEHICLES IN HOUSEHOLD
70.7/ 100
METRIC RATING
155th/ 347
METRIC RANK
57.9%
2 OR MORE VEHICLES IN HOUSEHOLD
99.1/ 100
METRIC RATING
87th/ 347
METRIC RANK
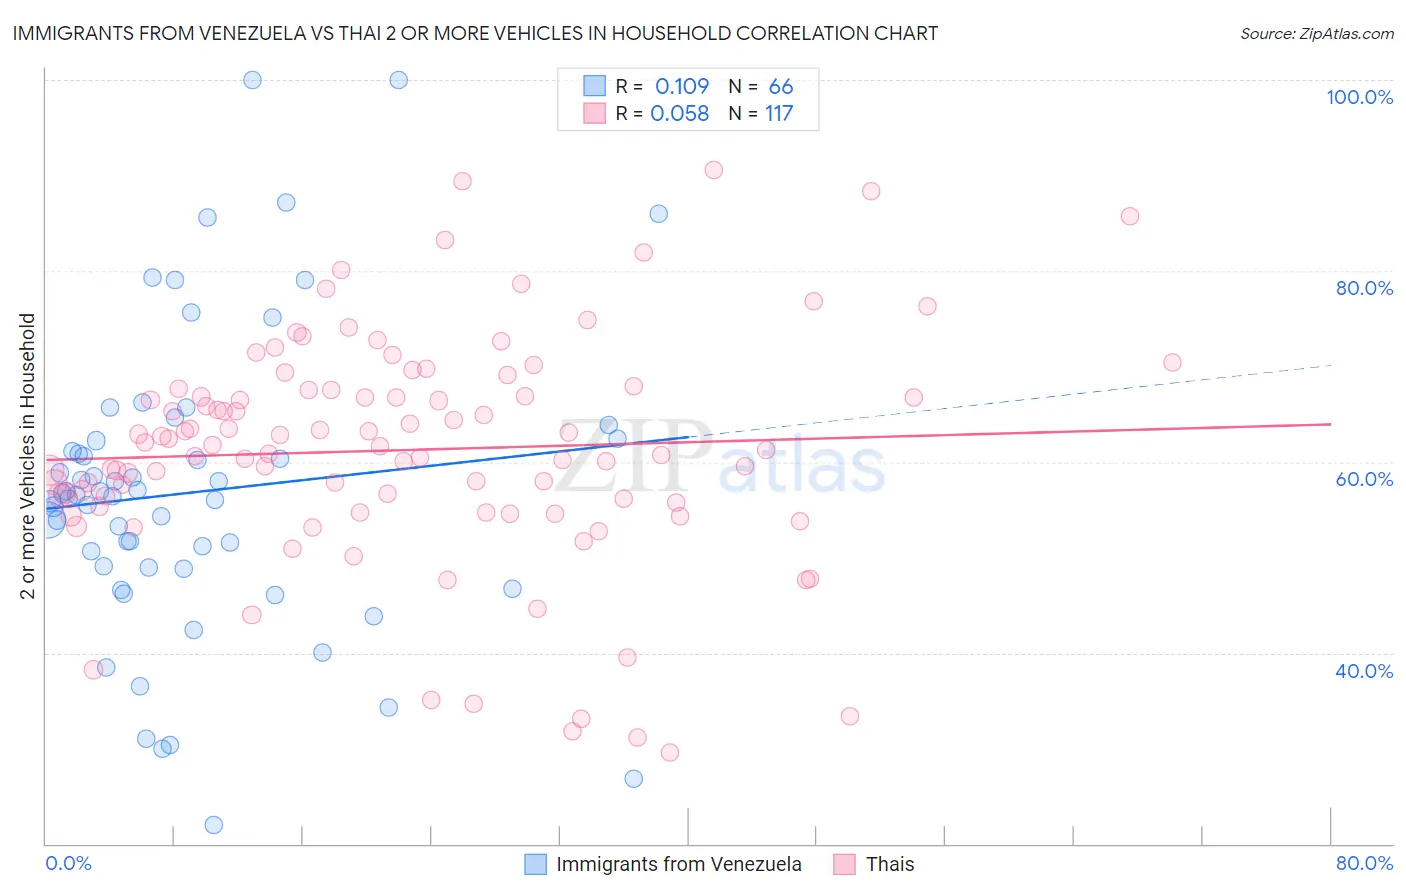
Immigrants from Venezuela vs Thai 2 or more Vehicles in Household Correlation Chart
The statistical analysis conducted on geographies consisting of 287,795,975 people shows a poor positive correlation between the proportion of Immigrants from Venezuela and percentage of households with 2 or more vehicles available in the United States with a correlation coefficient (R) of 0.109 and weighted average of 55.8%. Similarly, the statistical analysis conducted on geographies consisting of 475,419,380 people shows a slight positive correlation between the proportion of Thais and percentage of households with 2 or more vehicles available in the United States with a correlation coefficient (R) of 0.058 and weighted average of 57.9%, a difference of 3.8%.
2 or more Vehicles in Household Correlation Summary
| Measurement | Immigrants from Venezuela | Thai |
| Minimum | 22.0% | 29.5% |
| Maximum | 100.0% | 90.5% |
| Range | 78.0% | 61.0% |
| Mean | 56.8% | 61.2% |
| Median | 56.4% | 61.6% |
| Interquartile 25% (IQ1) | 49.0% | 55.6% |
| Interquartile 75% (IQ3) | 62.2% | 67.5% |
| Interquartile Range (IQR) | 13.3% | 11.9% |
| Standard Deviation (Sample) | 15.7% | 12.0% |
| Standard Deviation (Population) | 15.5% | 11.9% |
Similar Demographics by 2 or more Vehicles in Household
Demographics Similar to Immigrants from Venezuela by 2 or more Vehicles in Household
In terms of 2 or more vehicles in household, the demographic groups most similar to Immigrants from Venezuela are Ukrainian (55.8%, a difference of 0.0%), Immigrants from Lithuania (55.8%, a difference of 0.010%), Immigrants from Kuwait (55.8%, a difference of 0.030%), Lumbee (55.9%, a difference of 0.060%), and Tlingit-Haida (55.8%, a difference of 0.10%).
| Demographics | Rating | Rank | 2 or more Vehicles in Household |
| Immigrants | Moldova | 80.2 /100 | #148 | Excellent 56.1% |
| Chileans | 80.2 /100 | #149 | Excellent 56.1% |
| Nicaraguans | 79.9 /100 | #150 | Good 56.1% |
| Immigrants | Northern Europe | 78.7 /100 | #151 | Good 56.1% |
| Immigrants | Pakistan | 78.1 /100 | #152 | Good 56.1% |
| Lumbee | 71.9 /100 | #153 | Good 55.9% |
| Ukrainians | 70.8 /100 | #154 | Good 55.8% |
| Immigrants | Venezuela | 70.7 /100 | #155 | Good 55.8% |
| Immigrants | Lithuania | 70.4 /100 | #156 | Good 55.8% |
| Immigrants | Kuwait | 70.2 /100 | #157 | Good 55.8% |
| Tlingit-Haida | 68.5 /100 | #158 | Good 55.8% |
| Paiute | 68.0 /100 | #159 | Good 55.8% |
| Crow | 67.0 /100 | #160 | Good 55.7% |
| Colville | 61.1 /100 | #161 | Good 55.6% |
| German Russians | 60.9 /100 | #162 | Good 55.6% |
Demographics Similar to Thais by 2 or more Vehicles in Household
In terms of 2 or more vehicles in household, the demographic groups most similar to Thais are Immigrants from Iran (57.9%, a difference of 0.010%), Potawatomi (58.0%, a difference of 0.040%), Slovak (58.0%, a difference of 0.070%), Immigrants from Germany (57.9%, a difference of 0.080%), and Hispanic or Latino (57.9%, a difference of 0.080%).
| Demographics | Rating | Rank | 2 or more Vehicles in Household |
| Immigrants | England | 99.3 /100 | #80 | Exceptional 58.1% |
| Immigrants | Iraq | 99.3 /100 | #81 | Exceptional 58.1% |
| Iranians | 99.3 /100 | #82 | Exceptional 58.1% |
| Icelanders | 99.2 /100 | #83 | Exceptional 58.0% |
| Maltese | 99.2 /100 | #84 | Exceptional 58.0% |
| Slovaks | 99.2 /100 | #85 | Exceptional 58.0% |
| Potawatomi | 99.1 /100 | #86 | Exceptional 58.0% |
| Thais | 99.1 /100 | #87 | Exceptional 57.9% |
| Immigrants | Iran | 99.1 /100 | #88 | Exceptional 57.9% |
| Immigrants | Germany | 99.0 /100 | #89 | Exceptional 57.9% |
| Hispanics or Latinos | 99.0 /100 | #90 | Exceptional 57.9% |
| Pakistanis | 99.0 /100 | #91 | Exceptional 57.9% |
| Shoshone | 99.0 /100 | #92 | Exceptional 57.9% |
| Ottawa | 99.0 /100 | #93 | Exceptional 57.9% |
| Filipinos | 98.9 /100 | #94 | Exceptional 57.8% |