Immigrants from Trinidad and Tobago vs Immigrants from Central America 4 or more Vehicles in Household
COMPARE
Immigrants from Trinidad and Tobago
Immigrants from Central America
4 or more Vehicles in Household
4 or more Vehicles in Household Comparison
Immigrants from Trinidad and Tobago
Immigrants from Central America
4.1%
4 OR MORE VEHICLES IN HOUSEHOLD
0.0/ 100
METRIC RATING
334th/ 347
METRIC RANK
8.5%
4 OR MORE VEHICLES IN HOUSEHOLD
100.0/ 100
METRIC RATING
24th/ 347
METRIC RANK
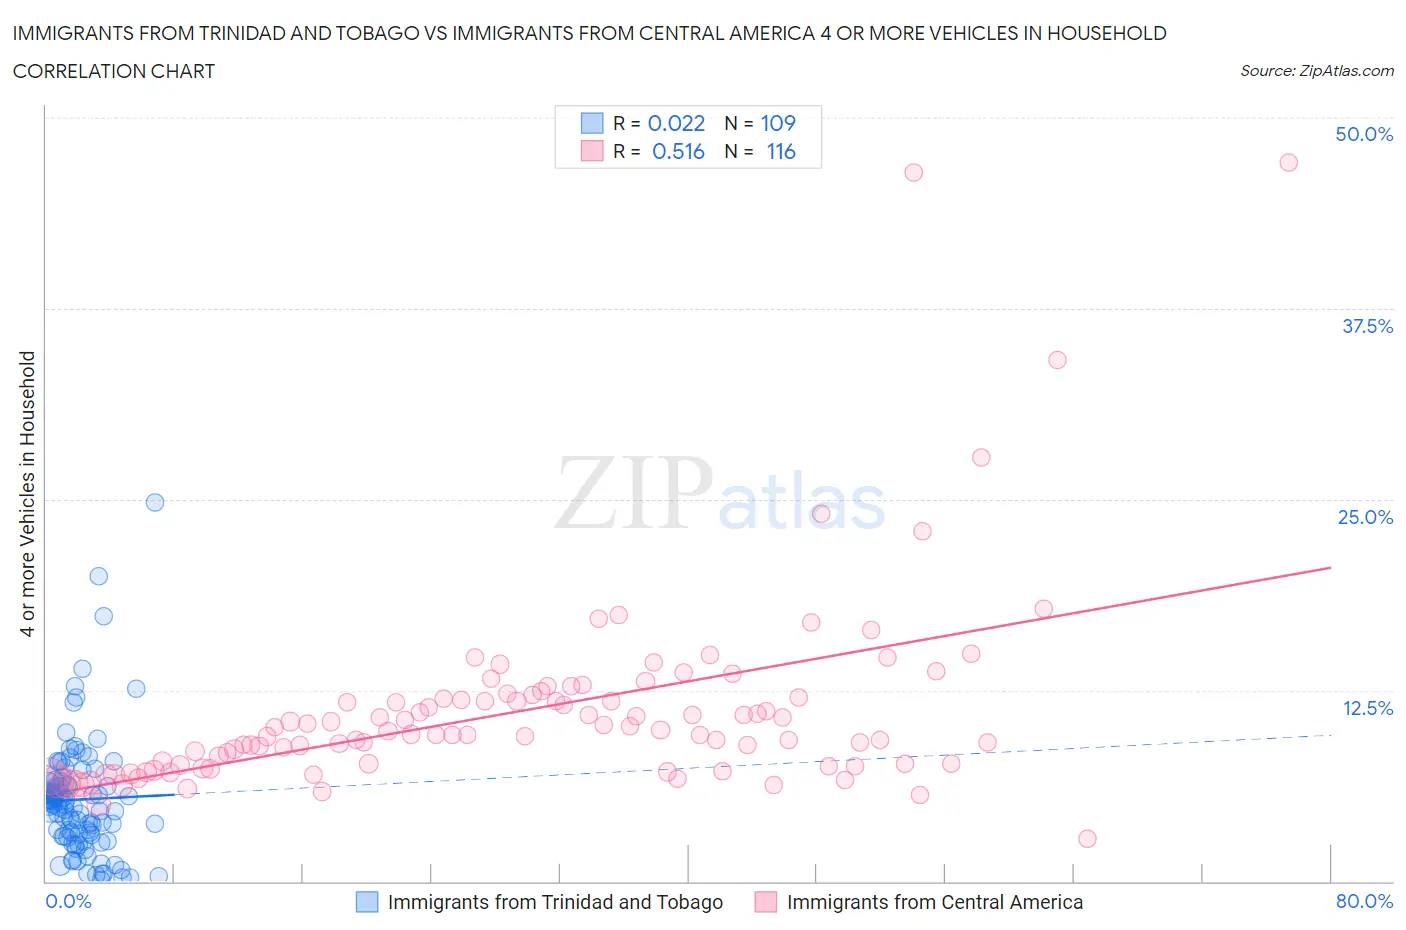
Immigrants from Trinidad and Tobago vs Immigrants from Central America 4 or more Vehicles in Household Correlation Chart
The statistical analysis conducted on geographies consisting of 222,352,936 people shows no correlation between the proportion of Immigrants from Trinidad and Tobago and percentage of households with 4 or more vehicles available in the United States with a correlation coefficient (R) of 0.022 and weighted average of 4.1%. Similarly, the statistical analysis conducted on geographies consisting of 533,607,321 people shows a substantial positive correlation between the proportion of Immigrants from Central America and percentage of households with 4 or more vehicles available in the United States with a correlation coefficient (R) of 0.516 and weighted average of 8.5%, a difference of 106.5%.
4 or more Vehicles in Household Correlation Summary
| Measurement | Immigrants from Trinidad and Tobago | Immigrants from Central America |
| Minimum | 0.11% | 2.8% |
| Maximum | 24.8% | 47.1% |
| Range | 24.7% | 44.3% |
| Mean | 5.3% | 11.2% |
| Median | 5.0% | 9.6% |
| Interquartile 25% (IQ1) | 3.0% | 7.6% |
| Interquartile 75% (IQ3) | 6.4% | 12.0% |
| Interquartile Range (IQR) | 3.4% | 4.4% |
| Standard Deviation (Sample) | 3.9% | 6.4% |
| Standard Deviation (Population) | 3.9% | 6.4% |
Similar Demographics by 4 or more Vehicles in Household
Demographics Similar to Immigrants from Trinidad and Tobago by 4 or more Vehicles in Household
In terms of 4 or more vehicles in household, the demographic groups most similar to Immigrants from Trinidad and Tobago are Immigrants from Albania (4.1%, a difference of 0.21%), Immigrants from Dominica (4.2%, a difference of 1.9%), West Indian (4.2%, a difference of 2.8%), Immigrants from Ecuador (4.2%, a difference of 3.1%), and Immigrants from Senegal (4.2%, a difference of 3.3%).
| Demographics | Rating | Rank | 4 or more Vehicles in Household |
| Senegalese | 0.0 /100 | #327 | Tragic 4.3% |
| Trinidadians and Tobagonians | 0.0 /100 | #328 | Tragic 4.3% |
| Immigrants | Senegal | 0.0 /100 | #329 | Tragic 4.2% |
| Immigrants | Ecuador | 0.0 /100 | #330 | Tragic 4.2% |
| West Indians | 0.0 /100 | #331 | Tragic 4.2% |
| Immigrants | Dominica | 0.0 /100 | #332 | Tragic 4.2% |
| Immigrants | Albania | 0.0 /100 | #333 | Tragic 4.1% |
| Immigrants | Trinidad and Tobago | 0.0 /100 | #334 | Tragic 4.1% |
| Barbadians | 0.0 /100 | #335 | Tragic 3.9% |
| Immigrants | Bangladesh | 0.0 /100 | #336 | Tragic 3.9% |
| Vietnamese | 0.0 /100 | #337 | Tragic 3.9% |
| Immigrants | Cabo Verde | 0.0 /100 | #338 | Tragic 3.8% |
| Immigrants | Uzbekistan | 0.0 /100 | #339 | Tragic 3.6% |
| Immigrants | Barbados | 0.0 /100 | #340 | Tragic 3.6% |
| Dominicans | 0.0 /100 | #341 | Tragic 3.5% |
Demographics Similar to Immigrants from Central America by 4 or more Vehicles in Household
In terms of 4 or more vehicles in household, the demographic groups most similar to Immigrants from Central America are Basque (8.4%, a difference of 0.54%), Immigrants from Philippines (8.5%, a difference of 0.82%), Mexican American Indian (8.4%, a difference of 0.86%), Sri Lankan (8.4%, a difference of 0.98%), and Immigrants from Vietnam (8.6%, a difference of 1.0%).
| Demographics | Rating | Rank | 4 or more Vehicles in Household |
| Ute | 100.0 /100 | #17 | Exceptional 8.8% |
| Nepalese | 100.0 /100 | #18 | Exceptional 8.7% |
| Koreans | 100.0 /100 | #19 | Exceptional 8.6% |
| Pueblo | 100.0 /100 | #20 | Exceptional 8.6% |
| Danes | 100.0 /100 | #21 | Exceptional 8.6% |
| Immigrants | Vietnam | 100.0 /100 | #22 | Exceptional 8.6% |
| Immigrants | Philippines | 100.0 /100 | #23 | Exceptional 8.5% |
| Immigrants | Central America | 100.0 /100 | #24 | Exceptional 8.5% |
| Basques | 100.0 /100 | #25 | Exceptional 8.4% |
| Mexican American Indians | 100.0 /100 | #26 | Exceptional 8.4% |
| Sri Lankans | 100.0 /100 | #27 | Exceptional 8.4% |
| Cheyenne | 100.0 /100 | #28 | Exceptional 8.3% |
| Immigrants | South Eastern Asia | 100.0 /100 | #29 | Exceptional 8.2% |
| Navajo | 100.0 /100 | #30 | Exceptional 8.2% |
| Natives/Alaskans | 100.0 /100 | #31 | Exceptional 8.2% |