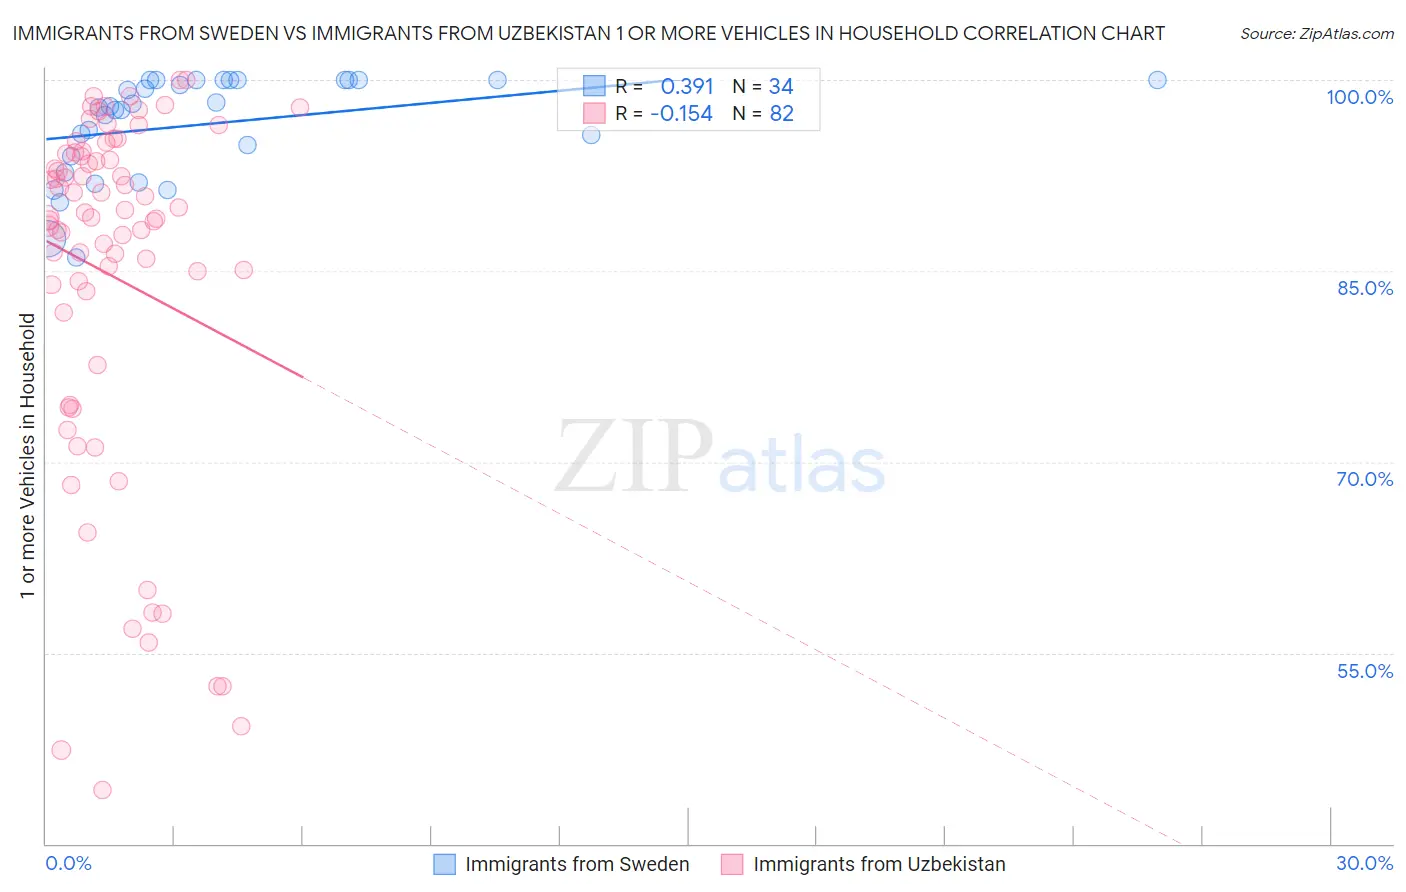
Immigrants from Sweden vs Immigrants from Uzbekistan 1 or more Vehicles in Household
COMPARE
Immigrants from Sweden
Immigrants from Uzbekistan
1 or more Vehicles in Household
1 or more Vehicles in Household Comparison
Immigrants from Sweden
Immigrants from Uzbekistan
89.3%
1 OR MORE VEHICLES IN HOUSEHOLD
23.6/ 100
METRIC RATING
197th/ 347
METRIC RANK
73.4%
1 OR MORE VEHICLES IN HOUSEHOLD
0.0/ 100
METRIC RATING
337th/ 347
METRIC RANK
Immigrants from Sweden vs Immigrants from Uzbekistan 1 or more Vehicles in Household Correlation Chart
The statistical analysis conducted on geographies consisting of 164,706,538 people shows a mild positive correlation between the proportion of Immigrants from Sweden and percentage of households with 1 or more vehicles available in the United States with a correlation coefficient (R) of 0.391 and weighted average of 89.3%. Similarly, the statistical analysis conducted on geographies consisting of 118,706,562 people shows a poor negative correlation between the proportion of Immigrants from Uzbekistan and percentage of households with 1 or more vehicles available in the United States with a correlation coefficient (R) of -0.154 and weighted average of 73.4%, a difference of 21.7%.
1 or more Vehicles in Household Correlation Summary
| Measurement | Immigrants from Sweden | Immigrants from Uzbekistan |
| Minimum | 86.1% | 44.2% |
| Maximum | 100.0% | 100.0% |
| Range | 13.9% | 55.8% |
| Mean | 96.5% | 84.6% |
| Median | 97.9% | 89.2% |
| Interquartile 25% (IQ1) | 94.0% | 81.7% |
| Interquartile 75% (IQ3) | 100.0% | 94.2% |
| Interquartile Range (IQR) | 6.0% | 12.4% |
| Standard Deviation (Sample) | 4.0% | 14.2% |
| Standard Deviation (Population) | 3.9% | 14.1% |
Similar Demographics by 1 or more Vehicles in Household
Demographics Similar to Immigrants from Sweden by 1 or more Vehicles in Household
In terms of 1 or more vehicles in household, the demographic groups most similar to Immigrants from Sweden are Crow (89.3%, a difference of 0.010%), Pennsylvania German (89.3%, a difference of 0.020%), Immigrants from Asia (89.3%, a difference of 0.020%), Central American (89.2%, a difference of 0.050%), and Immigrants from Western Europe (89.2%, a difference of 0.070%).
| Demographics | Rating | Rank | 1 or more Vehicles in Household |
| Shoshone | 37.5 /100 | #190 | Fair 89.5% |
| Immigrants | Poland | 37.1 /100 | #191 | Fair 89.5% |
| Immigrants | North Macedonia | 36.5 /100 | #192 | Fair 89.5% |
| Immigrants | Northern Europe | 35.5 /100 | #193 | Fair 89.5% |
| Immigrants | Eritrea | 33.2 /100 | #194 | Fair 89.4% |
| Immigrants | Armenia | 31.8 /100 | #195 | Fair 89.4% |
| Crow | 24.3 /100 | #196 | Fair 89.3% |
| Immigrants | Sweden | 23.6 /100 | #197 | Fair 89.3% |
| Pennsylvania Germans | 22.9 /100 | #198 | Fair 89.3% |
| Immigrants | Asia | 22.8 /100 | #199 | Fair 89.3% |
| Central Americans | 21.4 /100 | #200 | Fair 89.2% |
| Immigrants | Western Europe | 20.5 /100 | #201 | Fair 89.2% |
| Iroquois | 19.8 /100 | #202 | Poor 89.2% |
| Cambodians | 18.9 /100 | #203 | Poor 89.2% |
| Romanians | 18.2 /100 | #204 | Poor 89.2% |
Demographics Similar to Immigrants from Uzbekistan by 1 or more Vehicles in Household
In terms of 1 or more vehicles in household, the demographic groups most similar to Immigrants from Uzbekistan are Vietnamese (73.8%, a difference of 0.62%), Barbadian (74.0%, a difference of 0.82%), Immigrants from Bangladesh (74.3%, a difference of 1.3%), Inupiat (71.5%, a difference of 2.6%), and Guyanese (70.8%, a difference of 3.6%).
| Demographics | Rating | Rank | 1 or more Vehicles in Household |
| Immigrants | Trinidad and Tobago | 0.0 /100 | #330 | Tragic 76.8% |
| West Indians | 0.0 /100 | #331 | Tragic 76.4% |
| Trinidadians and Tobagonians | 0.0 /100 | #332 | Tragic 76.3% |
| Immigrants | Ecuador | 0.0 /100 | #333 | Tragic 76.2% |
| Immigrants | Bangladesh | 0.0 /100 | #334 | Tragic 74.3% |
| Barbadians | 0.0 /100 | #335 | Tragic 74.0% |
| Vietnamese | 0.0 /100 | #336 | Tragic 73.8% |
| Immigrants | Uzbekistan | 0.0 /100 | #337 | Tragic 73.4% |
| Inupiat | 0.0 /100 | #338 | Tragic 71.5% |
| Guyanese | 0.0 /100 | #339 | Tragic 70.8% |
| Dominicans | 0.0 /100 | #340 | Tragic 70.7% |
| Immigrants | Barbados | 0.0 /100 | #341 | Tragic 70.6% |
| Immigrants | Guyana | 0.0 /100 | #342 | Tragic 70.6% |
| British West Indians | 0.0 /100 | #343 | Tragic 70.4% |
| Immigrants | Dominican Republic | 0.0 /100 | #344 | Tragic 68.6% |