Immigrants from Singapore vs Immigrants from Nigeria 1 or more Vehicles in Household
COMPARE
Immigrants from Singapore
Immigrants from Nigeria
1 or more Vehicles in Household
1 or more Vehicles in Household Comparison
Immigrants from Singapore
Immigrants from Nigeria
87.2%
1 OR MORE VEHICLES IN HOUSEHOLD
0.1/ 100
METRIC RATING
275th/ 347
METRIC RANK
88.2%
1 OR MORE VEHICLES IN HOUSEHOLD
1.5/ 100
METRIC RATING
248th/ 347
METRIC RANK
Immigrants from Singapore vs Immigrants from Nigeria 1 or more Vehicles in Household Correlation Chart
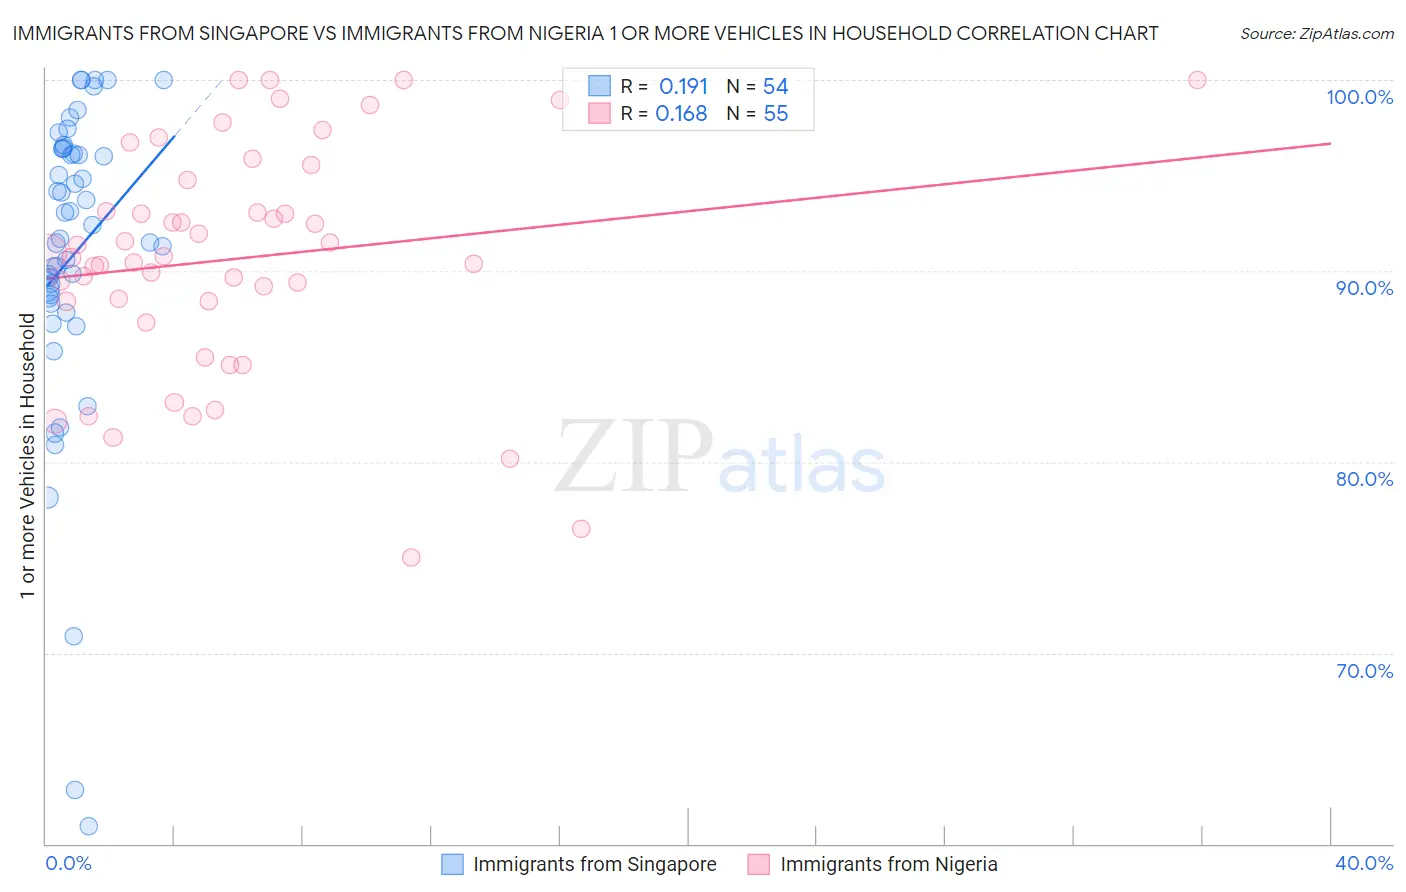
The statistical analysis conducted on geographies consisting of 137,467,600 people shows a poor positive correlation between the proportion of Immigrants from Singapore and percentage of households with 1 or more vehicles available in the United States with a correlation coefficient (R) of 0.191 and weighted average of 87.2%. Similarly, the statistical analysis conducted on geographies consisting of 283,317,819 people shows a poor positive correlation between the proportion of Immigrants from Nigeria and percentage of households with 1 or more vehicles available in the United States with a correlation coefficient (R) of 0.168 and weighted average of 88.2%, a difference of 1.2%.
1 or more Vehicles in Household Correlation Summary
| Measurement | Immigrants from Singapore | Immigrants from Nigeria |
| Minimum | 60.9% | 75.0% |
| Maximum | 100.0% | 100.0% |
| Range | 39.1% | 25.0% |
| Mean | 90.8% | 90.6% |
| Median | 92.0% | 90.8% |
| Interquartile 25% (IQ1) | 88.6% | 88.4% |
| Interquartile 75% (IQ3) | 96.4% | 94.7% |
| Interquartile Range (IQR) | 7.8% | 6.3% |
| Standard Deviation (Sample) | 8.3% | 6.0% |
| Standard Deviation (Population) | 8.3% | 5.9% |
Similar Demographics by 1 or more Vehicles in Household
Demographics Similar to Immigrants from Singapore by 1 or more Vehicles in Household
In terms of 1 or more vehicles in household, the demographic groups most similar to Immigrants from Singapore are Immigrants from France (87.1%, a difference of 0.070%), Alsatian (87.1%, a difference of 0.13%), Immigrants from Southern Europe (87.1%, a difference of 0.17%), Immigrants from Albania (87.1%, a difference of 0.17%), and Immigrants from Croatia (87.0%, a difference of 0.20%).
| Demographics | Rating | Rank | 1 or more Vehicles in Household |
| Immigrants | Europe | 0.2 /100 | #268 | Tragic 87.6% |
| Immigrants | Africa | 0.2 /100 | #269 | Tragic 87.6% |
| Panamanians | 0.2 /100 | #270 | Tragic 87.5% |
| Bermudans | 0.2 /100 | #271 | Tragic 87.5% |
| Aleuts | 0.2 /100 | #272 | Tragic 87.5% |
| Immigrants | Northern Africa | 0.2 /100 | #273 | Tragic 87.4% |
| Immigrants | Morocco | 0.1 /100 | #274 | Tragic 87.4% |
| Immigrants | Singapore | 0.1 /100 | #275 | Tragic 87.2% |
| Immigrants | France | 0.1 /100 | #276 | Tragic 87.1% |
| Alsatians | 0.1 /100 | #277 | Tragic 87.1% |
| Immigrants | Southern Europe | 0.1 /100 | #278 | Tragic 87.1% |
| Immigrants | Albania | 0.1 /100 | #279 | Tragic 87.1% |
| Immigrants | Croatia | 0.0 /100 | #280 | Tragic 87.0% |
| Mongolians | 0.0 /100 | #281 | Tragic 87.0% |
| Colville | 0.0 /100 | #282 | Tragic 86.8% |
Demographics Similar to Immigrants from Nigeria by 1 or more Vehicles in Household
In terms of 1 or more vehicles in household, the demographic groups most similar to Immigrants from Nigeria are Immigrants from Honduras (88.3%, a difference of 0.050%), Black/African American (88.2%, a difference of 0.050%), Menominee (88.3%, a difference of 0.080%), Immigrants from Czechoslovakia (88.3%, a difference of 0.090%), and Egyptian (88.2%, a difference of 0.090%).
| Demographics | Rating | Rank | 1 or more Vehicles in Household |
| Taiwanese | 2.6 /100 | #241 | Tragic 88.4% |
| Turks | 2.5 /100 | #242 | Tragic 88.4% |
| Immigrants | Belgium | 2.1 /100 | #243 | Tragic 88.4% |
| Immigrants | Portugal | 2.0 /100 | #244 | Tragic 88.3% |
| Immigrants | Czechoslovakia | 1.9 /100 | #245 | Tragic 88.3% |
| Menominee | 1.9 /100 | #246 | Tragic 88.3% |
| Immigrants | Honduras | 1.7 /100 | #247 | Tragic 88.3% |
| Immigrants | Nigeria | 1.5 /100 | #248 | Tragic 88.2% |
| Blacks/African Americans | 1.4 /100 | #249 | Tragic 88.2% |
| Egyptians | 1.2 /100 | #250 | Tragic 88.2% |
| Immigrants | Serbia | 1.2 /100 | #251 | Tragic 88.2% |
| Immigrants | Uruguay | 1.1 /100 | #252 | Tragic 88.1% |
| Hondurans | 1.0 /100 | #253 | Tragic 88.1% |
| Haitians | 0.9 /100 | #254 | Tragic 88.1% |
| Immigrants | Latvia | 0.9 /100 | #255 | Tragic 88.1% |