Immigrants from Europe vs Immigrants from Nigeria 1 or more Vehicles in Household
COMPARE
Immigrants from Europe
Immigrants from Nigeria
1 or more Vehicles in Household
1 or more Vehicles in Household Comparison
Immigrants from Europe
Immigrants from Nigeria
87.6%
1 OR MORE VEHICLES IN HOUSEHOLD
0.2/ 100
METRIC RATING
268th/ 347
METRIC RANK
88.2%
1 OR MORE VEHICLES IN HOUSEHOLD
1.5/ 100
METRIC RATING
248th/ 347
METRIC RANK
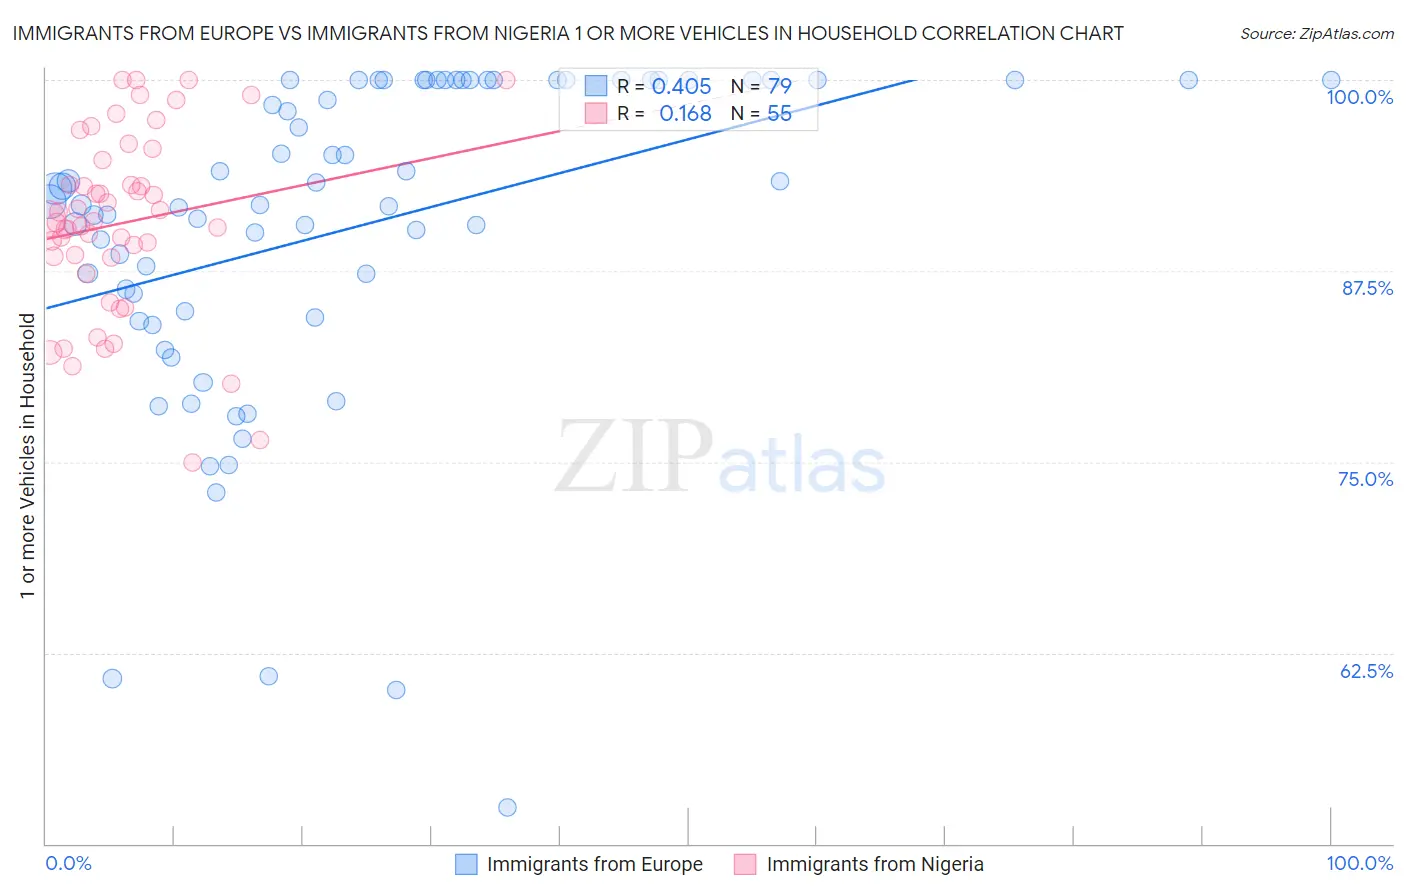
Immigrants from Europe vs Immigrants from Nigeria 1 or more Vehicles in Household Correlation Chart
The statistical analysis conducted on geographies consisting of 546,983,973 people shows a moderate positive correlation between the proportion of Immigrants from Europe and percentage of households with 1 or more vehicles available in the United States with a correlation coefficient (R) of 0.405 and weighted average of 87.6%. Similarly, the statistical analysis conducted on geographies consisting of 283,317,819 people shows a poor positive correlation between the proportion of Immigrants from Nigeria and percentage of households with 1 or more vehicles available in the United States with a correlation coefficient (R) of 0.168 and weighted average of 88.2%, a difference of 0.73%.
1 or more Vehicles in Household Correlation Summary
| Measurement | Immigrants from Europe | Immigrants from Nigeria |
| Minimum | 52.4% | 75.0% |
| Maximum | 100.0% | 100.0% |
| Range | 47.6% | 25.0% |
| Mean | 90.3% | 90.6% |
| Median | 92.1% | 90.8% |
| Interquartile 25% (IQ1) | 84.9% | 88.4% |
| Interquartile 75% (IQ3) | 100.0% | 94.7% |
| Interquartile Range (IQR) | 15.1% | 6.3% |
| Standard Deviation (Sample) | 10.7% | 6.0% |
| Standard Deviation (Population) | 10.6% | 5.9% |
Demographics Similar to Immigrants from Europe and Immigrants from Nigeria by 1 or more Vehicles in Household
In terms of 1 or more vehicles in household, the demographic groups most similar to Immigrants from Europe are Immigrants from Colombia (87.6%, a difference of 0.030%), Israeli (87.7%, a difference of 0.070%), African (87.8%, a difference of 0.21%), Immigrants from Liberia (87.8%, a difference of 0.23%), and Immigrants from Egypt (87.8%, a difference of 0.24%). Similarly, the demographic groups most similar to Immigrants from Nigeria are Black/African American (88.2%, a difference of 0.050%), Egyptian (88.2%, a difference of 0.090%), Immigrants from Serbia (88.2%, a difference of 0.10%), Immigrants from Uruguay (88.1%, a difference of 0.15%), and Honduran (88.1%, a difference of 0.19%).
| Demographics | Rating | Rank | 1 or more Vehicles in Household |
| Immigrants | Nigeria | 1.5 /100 | #248 | Tragic 88.2% |
| Blacks/African Americans | 1.4 /100 | #249 | Tragic 88.2% |
| Egyptians | 1.2 /100 | #250 | Tragic 88.2% |
| Immigrants | Serbia | 1.2 /100 | #251 | Tragic 88.2% |
| Immigrants | Uruguay | 1.1 /100 | #252 | Tragic 88.1% |
| Hondurans | 1.0 /100 | #253 | Tragic 88.1% |
| Haitians | 0.9 /100 | #254 | Tragic 88.1% |
| Immigrants | Latvia | 0.9 /100 | #255 | Tragic 88.1% |
| Colombians | 0.9 /100 | #256 | Tragic 88.0% |
| Liberians | 0.9 /100 | #257 | Tragic 88.0% |
| South American Indians | 0.9 /100 | #258 | Tragic 88.0% |
| Nigerians | 0.8 /100 | #259 | Tragic 88.0% |
| Macedonians | 0.6 /100 | #260 | Tragic 87.9% |
| Immigrants | Switzerland | 0.6 /100 | #261 | Tragic 87.9% |
| Sub-Saharan Africans | 0.5 /100 | #262 | Tragic 87.9% |
| Immigrants | Egypt | 0.5 /100 | #263 | Tragic 87.8% |
| Immigrants | Liberia | 0.4 /100 | #264 | Tragic 87.8% |
| Africans | 0.4 /100 | #265 | Tragic 87.8% |
| Israelis | 0.3 /100 | #266 | Tragic 87.7% |
| Immigrants | Colombia | 0.3 /100 | #267 | Tragic 87.6% |
| Immigrants | Europe | 0.2 /100 | #268 | Tragic 87.6% |