Immigrants from Bahamas vs Immigrants from Nigeria 1 or more Vehicles in Household
COMPARE
Immigrants from Bahamas
Immigrants from Nigeria
1 or more Vehicles in Household
1 or more Vehicles in Household Comparison
Immigrants from Bahamas
Immigrants from Nigeria
90.2%
1 OR MORE VEHICLES IN HOUSEHOLD
81.5/ 100
METRIC RATING
143rd/ 347
METRIC RANK
88.2%
1 OR MORE VEHICLES IN HOUSEHOLD
1.5/ 100
METRIC RATING
248th/ 347
METRIC RANK
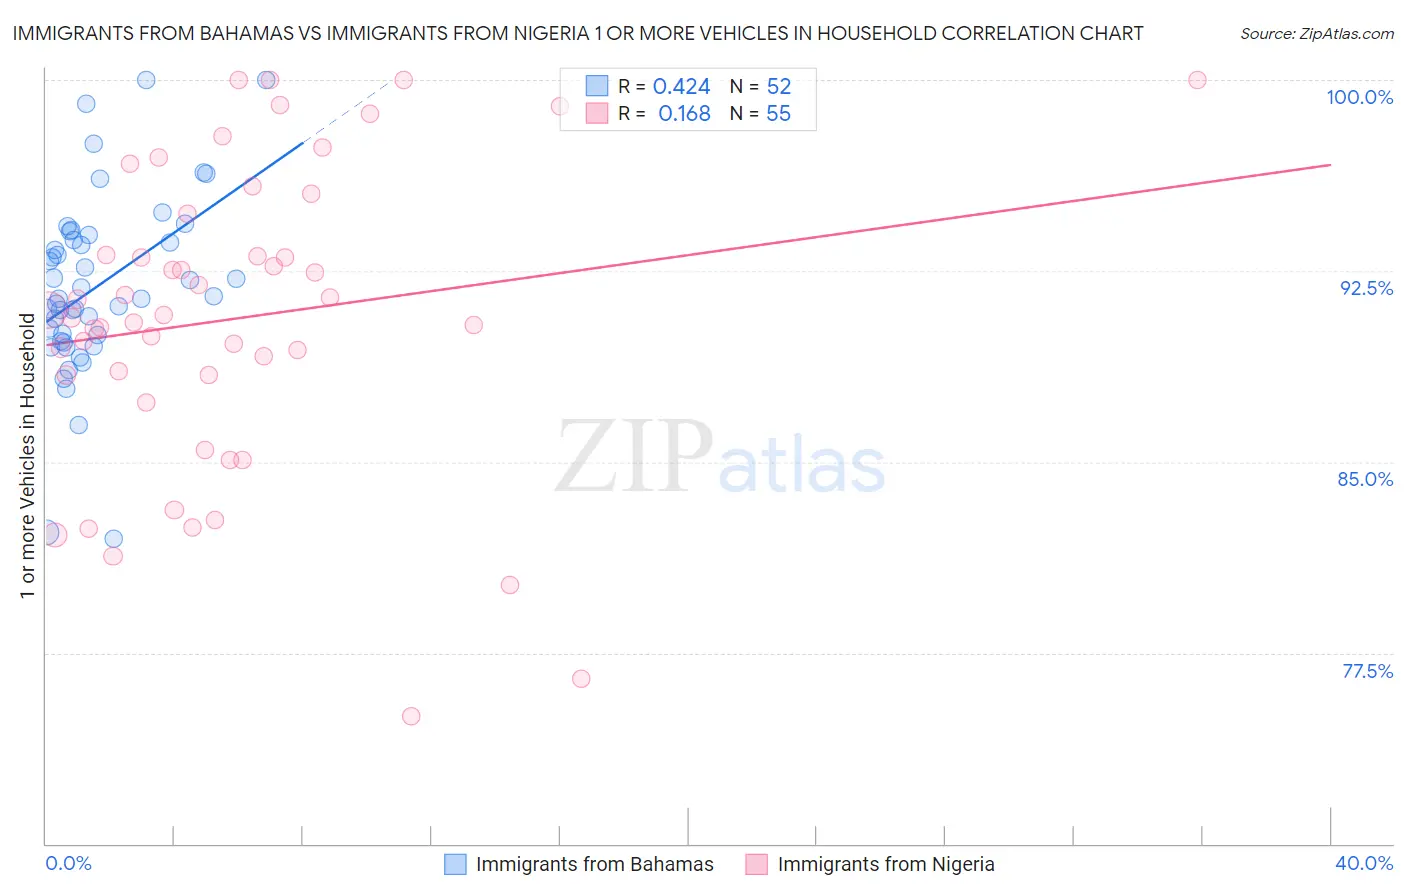
Immigrants from Bahamas vs Immigrants from Nigeria 1 or more Vehicles in Household Correlation Chart
The statistical analysis conducted on geographies consisting of 104,615,512 people shows a moderate positive correlation between the proportion of Immigrants from Bahamas and percentage of households with 1 or more vehicles available in the United States with a correlation coefficient (R) of 0.424 and weighted average of 90.2%. Similarly, the statistical analysis conducted on geographies consisting of 283,317,819 people shows a poor positive correlation between the proportion of Immigrants from Nigeria and percentage of households with 1 or more vehicles available in the United States with a correlation coefficient (R) of 0.168 and weighted average of 88.2%, a difference of 2.2%.
1 or more Vehicles in Household Correlation Summary
| Measurement | Immigrants from Bahamas | Immigrants from Nigeria |
| Minimum | 82.0% | 75.0% |
| Maximum | 100.0% | 100.0% |
| Range | 18.0% | 25.0% |
| Mean | 91.9% | 90.6% |
| Median | 91.5% | 90.8% |
| Interquartile 25% (IQ1) | 89.9% | 88.4% |
| Interquartile 75% (IQ3) | 93.8% | 94.7% |
| Interquartile Range (IQR) | 3.9% | 6.3% |
| Standard Deviation (Sample) | 3.6% | 6.0% |
| Standard Deviation (Population) | 3.5% | 5.9% |
Similar Demographics by 1 or more Vehicles in Household
Demographics Similar to Immigrants from Bahamas by 1 or more Vehicles in Household
In terms of 1 or more vehicles in household, the demographic groups most similar to Immigrants from Bahamas are Immigrants from Zimbabwe (90.2%, a difference of 0.0%), Sioux (90.2%, a difference of 0.010%), Bahamian (90.2%, a difference of 0.030%), Immigrants from Moldova (90.2%, a difference of 0.040%), and Immigrants from Lithuania (90.2%, a difference of 0.040%).
| Demographics | Rating | Rank | 1 or more Vehicles in Household |
| Hungarians | 86.5 /100 | #136 | Excellent 90.3% |
| Latvians | 86.3 /100 | #137 | Excellent 90.3% |
| Syrians | 86.3 /100 | #138 | Excellent 90.3% |
| Estonians | 85.6 /100 | #139 | Excellent 90.3% |
| Sudanese | 85.2 /100 | #140 | Excellent 90.3% |
| Immigrants | Moldova | 83.1 /100 | #141 | Excellent 90.2% |
| Immigrants | Lithuania | 83.0 /100 | #142 | Excellent 90.2% |
| Immigrants | Bahamas | 81.5 /100 | #143 | Excellent 90.2% |
| Immigrants | Zimbabwe | 81.5 /100 | #144 | Excellent 90.2% |
| Sioux | 81.3 /100 | #145 | Excellent 90.2% |
| Bahamians | 80.5 /100 | #146 | Excellent 90.2% |
| Chileans | 79.8 /100 | #147 | Good 90.2% |
| Immigrants | Eastern Africa | 78.2 /100 | #148 | Good 90.1% |
| Immigrants | Nicaragua | 76.7 /100 | #149 | Good 90.1% |
| Immigrants | Micronesia | 75.9 /100 | #150 | Good 90.1% |
Demographics Similar to Immigrants from Nigeria by 1 or more Vehicles in Household
In terms of 1 or more vehicles in household, the demographic groups most similar to Immigrants from Nigeria are Immigrants from Honduras (88.3%, a difference of 0.050%), Black/African American (88.2%, a difference of 0.050%), Menominee (88.3%, a difference of 0.080%), Immigrants from Czechoslovakia (88.3%, a difference of 0.090%), and Egyptian (88.2%, a difference of 0.090%).
| Demographics | Rating | Rank | 1 or more Vehicles in Household |
| Taiwanese | 2.6 /100 | #241 | Tragic 88.4% |
| Turks | 2.5 /100 | #242 | Tragic 88.4% |
| Immigrants | Belgium | 2.1 /100 | #243 | Tragic 88.4% |
| Immigrants | Portugal | 2.0 /100 | #244 | Tragic 88.3% |
| Immigrants | Czechoslovakia | 1.9 /100 | #245 | Tragic 88.3% |
| Menominee | 1.9 /100 | #246 | Tragic 88.3% |
| Immigrants | Honduras | 1.7 /100 | #247 | Tragic 88.3% |
| Immigrants | Nigeria | 1.5 /100 | #248 | Tragic 88.2% |
| Blacks/African Americans | 1.4 /100 | #249 | Tragic 88.2% |
| Egyptians | 1.2 /100 | #250 | Tragic 88.2% |
| Immigrants | Serbia | 1.2 /100 | #251 | Tragic 88.2% |
| Immigrants | Uruguay | 1.1 /100 | #252 | Tragic 88.1% |
| Hondurans | 1.0 /100 | #253 | Tragic 88.1% |
| Haitians | 0.9 /100 | #254 | Tragic 88.1% |
| Immigrants | Latvia | 0.9 /100 | #255 | Tragic 88.1% |