Immigrants from Singapore vs Immigrants from Latin America 4 or more Vehicles in Household

COMPARE

Immigrants from Singapore
Race
Ancestry
AfghanAfricanAlaska NativeAlaskan AthabascanAlbanianAleutAlsatianAmericanApacheArabArapahoArgentineanArmenianAssyrian/Chaldean/SyriacAustralianAustrianBahamianBangladeshiBarbadianBasqueBelgianBelizeanBermudanBhutaneseBlackfeetBolivianBrazilianBritishBritish West IndianBulgarianBurmeseCajunCambodianCanadianCape VerdeanCarpatho RusynCelticCentral AmericanCentral American IndianCherokeeCheyenneChickasawChileanChineseChippewaChoctawColombianColvilleComancheCosta RicanCreeCreekCroatianCrowCubanCypriotCzechCzechoslovakianDanishDelawareDominicanDutchDutch West IndianEastern EuropeanEcuadorianEgyptianEnglishEstonianEthiopianEuropeanFijianFilipinoFinnishFrenchFrench American IndianFrench CanadianGermanGerman RussianGhanaianGreekGuamanian/ChamorroGuatemalanGuyaneseHaitianHmongHonduranHopiHoumaHungarianIcelanderIndian (Asian)IndonesianInupiatIranianIraqiIrishIroquoisIsraeliItalianJamaicanJapaneseJordanianKenyanKiowaKoreanLaotianLatvianLebaneseLiberianLithuanianLumbeeLuxembourgerMacedonianMalaysianMalteseMarshalleseMenomineeMexicanMexican American IndianMongolianMoroccanNative HawaiianNavajoNepaleseNew ZealanderNicaraguanNigerianNorthern EuropeanNorwegianOkinawanOsageOttawaPaiutePakistaniPalestinianPanamanianParaguayanPennsylvania GermanPeruvianPimaPolishPortuguesePotawatomiPuebloPuerto RicanPuget Sound SalishRomanianRussianSalvadoranSamoanScandinavianScotch-IrishScottishSeminoleSenegaleseSerbianShoshoneSierra LeoneanSiouxSlavicSlovakSloveneSomaliSouth AfricanSouth AmericanSouth American IndianSoviet UnionSpaniardSpanishSpanish AmericanSpanish American IndianSri LankanSubsaharan AfricanSudaneseSwedishSwissSyrianTaiwaneseThaiTlingit-HaidaTohono O'OdhamTonganTrinidadian and TobagonianTsimshianTurkishU.S. Virgin IslanderUgandanUkrainianUruguayanUteVenezuelanVietnameseWelshWest IndianYakamaYaquiYugoslavianYumanYup'ikZimbabwean
Immigration
NonimmigrantsImmigrantsAfghanistanAfricaAlbaniaArgentinaArmeniaAsiaAustraliaAustriaBahamasBangladeshBarbadosBelarusBelgiumBelizeBoliviaBosnia and HerzegovinaBrazilBulgariaBurma/MyanmarCabo VerdeCambodiaCameroonCanadaCaribbeanCentral AmericaChileChinaColombiaCongoCosta RicaCroatiaCubaCzechoslovakiaDenmarkDominicaDominican RepublicEastern AfricaEastern AsiaEastern EuropeEcuadorEgyptEl SalvadorEnglandEritreaEthiopiaEuropeFijiFranceGermanyGhanaGreeceGrenadaGuatemalaGuyanaHaitiHondurasHong KongHungaryIndiaIndonesiaIranIraqIrelandIsraelItalyJamaicaJapanJordanKazakhstanKenyaKoreaKuwaitLaosLatviaLebanonLiberiaLithuaniaMalaysiaMexicoMicronesiaMiddle AfricaMoldovaMoroccoNepalNetherlandsNicaraguaNigeriaNorth AmericaNorth MacedoniaNorthern AfricaNorthern EuropeNorwayOceaniaPakistanPanamaPeruPhilippinesPolandPortugalRomaniaRussiaSaudi ArabiaScotlandSenegalSerbiaSierra LeoneSingaporeSomaliaSouth AfricaSouth AmericaSouth Central AsiaSouth Eastern AsiaSouthern EuropeSpainSri LankaSt. Vincent and the GrenadinesSudanSwedenSwitzerlandSyriaTaiwanThailandTrinidad and TobagoTurkeyUgandaUkraineUruguayUzbekistanVenezuelaVietnamWest IndiesWestern AfricaWestern AsiaWestern EuropeYemenZaireZimbabweAzores
Immigrants from Latin America
Race
Ancestry
AfghanAfricanAlaska NativeAlaskan AthabascanAlbanianAleutAlsatianAmericanApacheArabArapahoArgentineanArmenianAssyrian/Chaldean/SyriacAustralianAustrianBahamianBangladeshiBarbadianBasqueBelgianBelizeanBermudanBhutaneseBlackfeetBolivianBrazilianBritishBritish West IndianBulgarianBurmeseCajunCambodianCanadianCape VerdeanCarpatho RusynCelticCentral AmericanCentral American IndianCherokeeCheyenneChickasawChileanChineseChippewaChoctawColombianColvilleComancheCosta RicanCreeCreekCroatianCrowCubanCypriotCzechCzechoslovakianDanishDelawareDominicanDutchDutch West IndianEastern EuropeanEcuadorianEgyptianEnglishEstonianEthiopianEuropeanFijianFilipinoFinnishFrenchFrench American IndianFrench CanadianGermanGerman RussianGhanaianGreekGuamanian/ChamorroGuatemalanGuyaneseHaitianHmongHonduranHopiHoumaHungarianIcelanderIndian (Asian)IndonesianInupiatIranianIraqiIrishIroquoisIsraeliItalianJamaicanJapaneseJordanianKenyanKiowaKoreanLaotianLatvianLebaneseLiberianLithuanianLumbeeLuxembourgerMacedonianMalaysianMalteseMarshalleseMenomineeMexicanMexican American IndianMongolianMoroccanNative HawaiianNavajoNepaleseNew ZealanderNicaraguanNigerianNorthern EuropeanNorwegianOkinawanOsageOttawaPaiutePakistaniPalestinianPanamanianParaguayanPennsylvania GermanPeruvianPimaPolishPortuguesePotawatomiPuebloPuerto RicanPuget Sound SalishRomanianRussianSalvadoranSamoanScandinavianScotch-IrishScottishSeminoleSenegaleseSerbianShoshoneSierra LeoneanSiouxSlavicSlovakSloveneSomaliSouth AfricanSouth AmericanSouth American IndianSoviet UnionSpaniardSpanishSpanish AmericanSpanish American IndianSri LankanSubsaharan AfricanSudaneseSwedishSwissSyrianTaiwaneseThaiTlingit-HaidaTohono O'OdhamTonganTrinidadian and TobagonianTsimshianTurkishU.S. Virgin IslanderUgandanUkrainianUruguayanUteVenezuelanVietnameseWelshWest IndianYakamaYaquiYugoslavianYumanYup'ikZimbabwean
Immigration
NonimmigrantsImmigrantsAfghanistanAfricaAlbaniaArgentinaArmeniaAsiaAustraliaAustriaBahamasBangladeshBarbadosBelarusBelgiumBelizeBoliviaBosnia and HerzegovinaBrazilBulgariaBurma/MyanmarCabo VerdeCambodiaCameroonCanadaCaribbeanCentral AmericaChileChinaColombiaCongoCosta RicaCroatiaCubaCzechoslovakiaDenmarkDominicaDominican RepublicEastern AfricaEastern AsiaEastern EuropeEcuadorEgyptEl SalvadorEnglandEritreaEthiopiaEuropeFijiFranceGermanyGhanaGreeceGrenadaGuatemalaGuyanaHaitiHondurasHong KongHungaryIndiaIndonesiaIranIraqIrelandIsraelItalyJamaicaJapanJordanKazakhstanKenyaKoreaKuwaitLaosLatin AmericaLatviaLebanonLiberiaLithuaniaMalaysiaMexicoMicronesiaMiddle AfricaMoldovaMoroccoNepalNetherlandsNicaraguaNigeriaNorth AmericaNorth MacedoniaNorthern AfricaNorthern EuropeNorwayOceaniaPakistanPanamaPeruPhilippinesPolandPortugalRomaniaRussiaSaudi ArabiaScotlandSenegalSerbiaSierra LeoneSomaliaSouth AfricaSouth AmericaSouth Central AsiaSouth Eastern AsiaSouthern EuropeSpainSri LankaSt. Vincent and the GrenadinesSudanSwedenSwitzerlandSyriaTaiwanThailandTrinidad and TobagoTurkeyUgandaUkraineUruguayUzbekistanVenezuelaVietnamWest IndiesWestern AfricaWestern AsiaWestern EuropeYemenZaireZimbabweAzores
4 or more Vehicles in Household
Income
Poverty
Unemployment
Labor Participation
Family Structure
Vehicle Availability
Education Level
Disability

4 or more Vehicles in Household Comparison

Immigrants from Singapore

Immigrants from Latin America

Tragic
Exceptional
5.9%
4 OR MORE VEHICLES IN HOUSEHOLD
7.9/ 100
METRIC RATING
226th/ 347
METRIC RANK
7.1%
4 OR MORE VEHICLES IN HOUSEHOLD
99.4/ 100
METRIC RATING
92nd/ 347
METRIC RANK

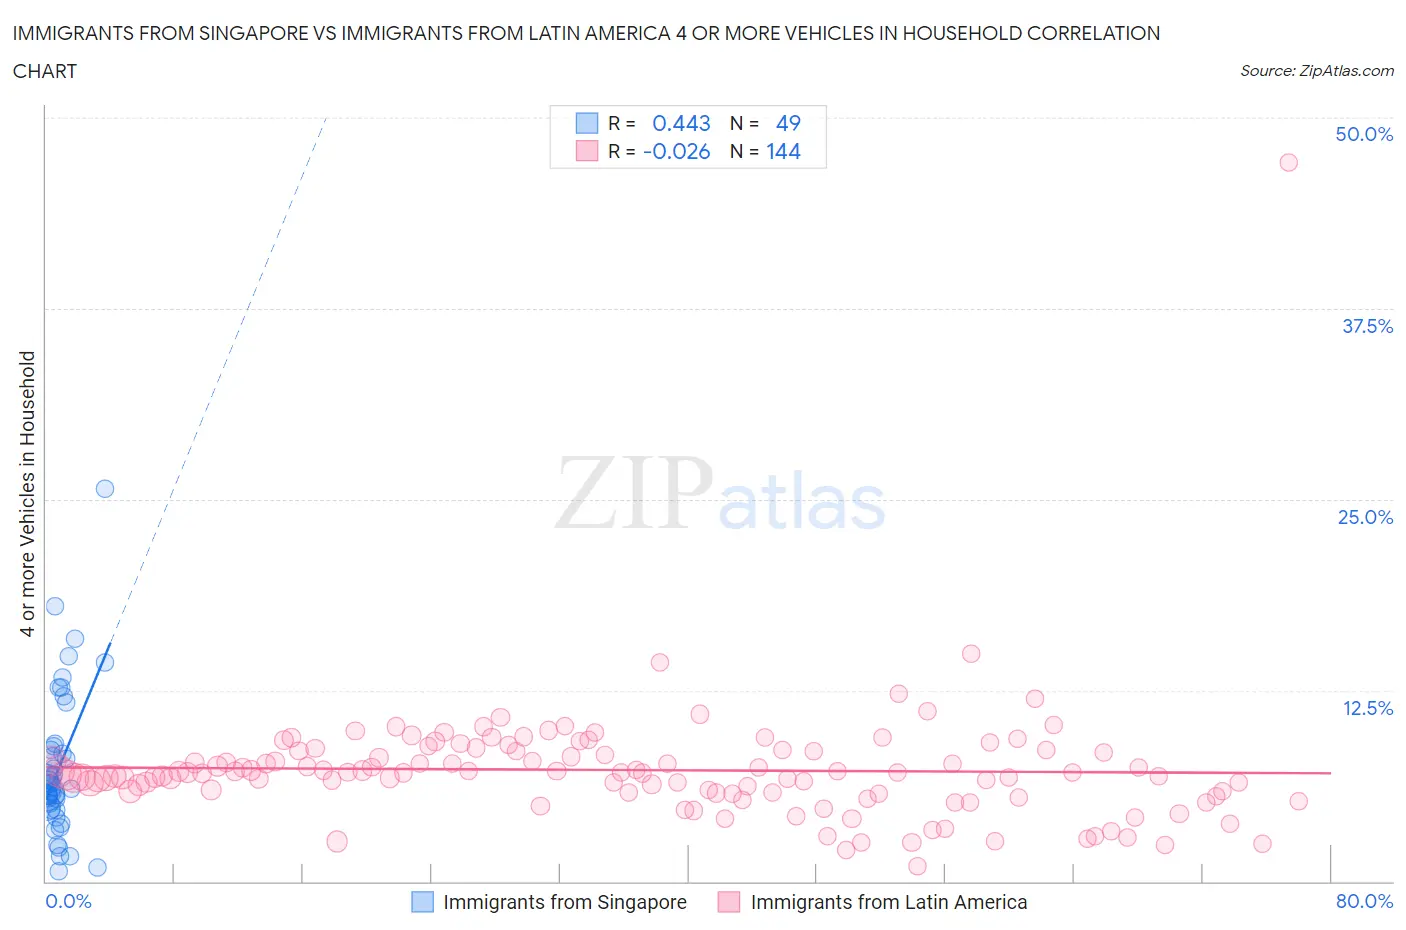
Immigrants from Singapore vs Immigrants from Latin America 4 or more Vehicles in Household Correlation Chart

The statistical analysis conducted on geographies consisting of 136,732,831 people shows a moderate positive correlation between the proportion of Immigrants from Singapore and percentage of households with 4 or more vehicles available in the United States with a correlation coefficient (R) of 0.443 and weighted average of 5.9%. Similarly, the statistical analysis conducted on geographies consisting of 555,198,992 people shows no correlation between the proportion of Immigrants from Latin America and percentage of households with 4 or more vehicles available in the United States with a correlation coefficient (R) of -0.026 and weighted average of 7.1%, a difference of 20.4%.
Immigrants from Singapore vs Immigrants from Latin America 4 or more Vehicles in Household

4 or more Vehicles in Household Correlation Summary

MeasurementImmigrants from SingaporeImmigrants from Latin America
Minimum0.67%1.0%
Maximum25.7%47.1%
Range25.0%46.0%
Mean7.4%7.3%
Median6.2%7.1%
Interquartile 25% (IQ1)4.7%5.8%
Interquartile 75% (IQ3)8.7%8.5%
Interquartile Range (IQR)4.0%2.8%
Standard Deviation (Sample)4.7%4.1%
Standard Deviation (Population)4.7%4.1%

Similar Demographics by 4 or more Vehicles in Household

Demographics Similar to Immigrants from Singapore by 4 or more Vehicles in Household

In terms of 4 or more vehicles in household, the demographic groups most similar to Immigrants from Singapore are Immigrants from Western Asia (5.9%, a difference of 0.040%), Immigrants from Uganda (5.9%, a difference of 0.13%), Indonesian (6.0%, a difference of 0.38%), Eastern European (5.9%, a difference of 0.41%), and Cuban (6.0%, a difference of 0.46%).
DemographicsRating | Rank4 or more Vehicles in Household
Serbians
11.0
/100
|
#219
Poor
6.0%
Russians
10.3
/100
|
#220
Poor
6.0%
Immigrants | Moldova
9.3
/100
|
#221
Tragic
6.0%
Cajuns
9.2
/100
|
#222
Tragic
6.0%
Immigrants | Kenya
9.2
/100
|
#223
Tragic
6.0%
Cubans
9.2
/100
|
#224
Tragic
6.0%
Indonesians
8.9
/100
|
#225
Tragic
6.0%
Immigrants | Singapore
7.9
/100
|
#226
Tragic
5.9%
Immigrants | Western Asia
7.8
/100
|
#227
Tragic
5.9%
Immigrants | Uganda
7.5
/100
|
#228
Tragic
5.9%
Eastern Europeans
6.8
/100
|
#229
Tragic
5.9%
Immigrants | Malaysia
6.7
/100
|
#230
Tragic
5.9%
Immigrants | Switzerland
6.4
/100
|
#231
Tragic
5.9%
Immigrants | Argentina
6.0
/100
|
#232
Tragic
5.9%
Sierra Leoneans
6.0
/100
|
#233
Tragic
5.9%

Demographics Similar to Immigrants from Latin America by 4 or more Vehicles in Household

In terms of 4 or more vehicles in household, the demographic groups most similar to Immigrants from Latin America are Assyrian/Chaldean/Syriac (7.2%, a difference of 0.16%), Immigrants from Afghanistan (7.1%, a difference of 0.17%), Dutch West Indian (7.1%, a difference of 0.18%), Czechoslovakian (7.1%, a difference of 0.39%), and Central American (7.1%, a difference of 0.41%).
DemographicsRating | Rank4 or more Vehicles in Household
Cree
99.7
/100
|
#85
Exceptional
7.2%
Immigrants | Indonesia
99.6
/100
|
#86
Exceptional
7.2%
Delaware
99.6
/100
|
#87
Exceptional
7.2%
Immigrants | Nonimmigrants
99.6
/100
|
#88
Exceptional
7.2%
British
99.6
/100
|
#89
Exceptional
7.2%
Creek
99.6
/100
|
#90
Exceptional
7.2%
Assyrians/Chaldeans/Syriacs
99.4
/100
|
#91
Exceptional
7.2%
Immigrants | Latin America
99.4
/100
|
#92
Exceptional
7.1%
Immigrants | Afghanistan
99.3
/100
|
#93
Exceptional
7.1%
Dutch West Indians
99.3
/100
|
#94
Exceptional
7.1%
Czechoslovakians
99.3
/100
|
#95
Exceptional
7.1%
Central Americans
99.3
/100
|
#96
Exceptional
7.1%
Celtics
99.1
/100
|
#97
Exceptional
7.1%
Irish
99.0
/100
|
#98
Exceptional
7.1%
Seminole
98.8
/100
|
#99
Exceptional
7.0%