Immigrants from Singapore vs Fijian 4 or more Vehicles in Household
COMPARE
Immigrants from Singapore
Fijian
4 or more Vehicles in Household
4 or more Vehicles in Household Comparison
Immigrants from Singapore
Fijians
5.9%
4 OR MORE VEHICLES IN HOUSEHOLD
7.9/ 100
METRIC RATING
226th/ 347
METRIC RANK
7.8%
4 OR MORE VEHICLES IN HOUSEHOLD
100.0/ 100
METRIC RATING
43rd/ 347
METRIC RANK
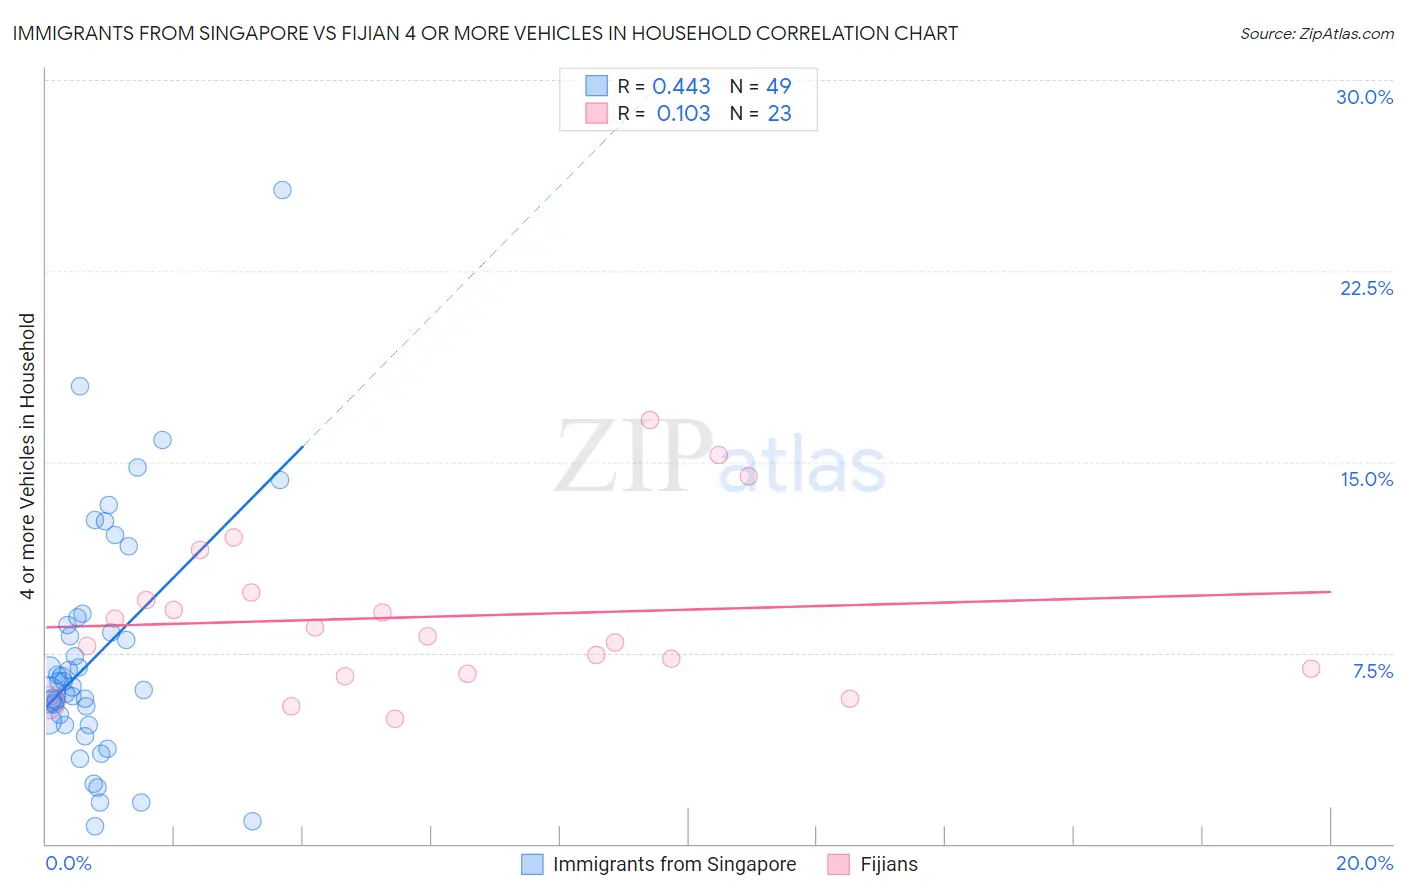
Immigrants from Singapore vs Fijian 4 or more Vehicles in Household Correlation Chart
The statistical analysis conducted on geographies consisting of 136,732,831 people shows a moderate positive correlation between the proportion of Immigrants from Singapore and percentage of households with 4 or more vehicles available in the United States with a correlation coefficient (R) of 0.443 and weighted average of 5.9%. Similarly, the statistical analysis conducted on geographies consisting of 55,944,814 people shows a poor positive correlation between the proportion of Fijians and percentage of households with 4 or more vehicles available in the United States with a correlation coefficient (R) of 0.103 and weighted average of 7.8%, a difference of 31.8%.
4 or more Vehicles in Household Correlation Summary
| Measurement | Immigrants from Singapore | Fijian |
| Minimum | 0.67% | 4.9% |
| Maximum | 25.7% | 16.7% |
| Range | 25.0% | 11.7% |
| Mean | 7.4% | 8.9% |
| Median | 6.2% | 8.2% |
| Interquartile 25% (IQ1) | 4.7% | 6.7% |
| Interquartile 75% (IQ3) | 8.7% | 9.9% |
| Interquartile Range (IQR) | 4.0% | 3.2% |
| Standard Deviation (Sample) | 4.7% | 3.2% |
| Standard Deviation (Population) | 4.7% | 3.1% |
Similar Demographics by 4 or more Vehicles in Household
Demographics Similar to Immigrants from Singapore by 4 or more Vehicles in Household
In terms of 4 or more vehicles in household, the demographic groups most similar to Immigrants from Singapore are Immigrants from Western Asia (5.9%, a difference of 0.040%), Immigrants from Uganda (5.9%, a difference of 0.13%), Indonesian (6.0%, a difference of 0.38%), Eastern European (5.9%, a difference of 0.41%), and Cuban (6.0%, a difference of 0.46%).
| Demographics | Rating | Rank | 4 or more Vehicles in Household |
| Serbians | 11.0 /100 | #219 | Poor 6.0% |
| Russians | 10.3 /100 | #220 | Poor 6.0% |
| Immigrants | Moldova | 9.3 /100 | #221 | Tragic 6.0% |
| Cajuns | 9.2 /100 | #222 | Tragic 6.0% |
| Immigrants | Kenya | 9.2 /100 | #223 | Tragic 6.0% |
| Cubans | 9.2 /100 | #224 | Tragic 6.0% |
| Indonesians | 8.9 /100 | #225 | Tragic 6.0% |
| Immigrants | Singapore | 7.9 /100 | #226 | Tragic 5.9% |
| Immigrants | Western Asia | 7.8 /100 | #227 | Tragic 5.9% |
| Immigrants | Uganda | 7.5 /100 | #228 | Tragic 5.9% |
| Eastern Europeans | 6.8 /100 | #229 | Tragic 5.9% |
| Immigrants | Malaysia | 6.7 /100 | #230 | Tragic 5.9% |
| Immigrants | Switzerland | 6.4 /100 | #231 | Tragic 5.9% |
| Immigrants | Argentina | 6.0 /100 | #232 | Tragic 5.9% |
| Sierra Leoneans | 6.0 /100 | #233 | Tragic 5.9% |
Demographics Similar to Fijians by 4 or more Vehicles in Household
In terms of 4 or more vehicles in household, the demographic groups most similar to Fijians are Salvadoran (7.8%, a difference of 0.11%), Bhutanese (7.8%, a difference of 0.26%), Choctaw (7.8%, a difference of 0.31%), Crow (7.8%, a difference of 0.49%), and Pima (7.9%, a difference of 0.60%).
| Demographics | Rating | Rank | 4 or more Vehicles in Household |
| Norwegians | 100.0 /100 | #36 | Exceptional 8.0% |
| Scandinavians | 100.0 /100 | #37 | Exceptional 8.0% |
| Sioux | 100.0 /100 | #38 | Exceptional 8.0% |
| Spanish Americans | 100.0 /100 | #39 | Exceptional 8.0% |
| Spanish | 100.0 /100 | #40 | Exceptional 7.9% |
| Pima | 100.0 /100 | #41 | Exceptional 7.9% |
| Salvadorans | 100.0 /100 | #42 | Exceptional 7.8% |
| Fijians | 100.0 /100 | #43 | Exceptional 7.8% |
| Bhutanese | 100.0 /100 | #44 | Exceptional 7.8% |
| Choctaw | 100.0 /100 | #45 | Exceptional 7.8% |
| Crow | 100.0 /100 | #46 | Exceptional 7.8% |
| Osage | 100.0 /100 | #47 | Exceptional 7.8% |
| Swiss | 100.0 /100 | #48 | Exceptional 7.8% |
| Cherokee | 100.0 /100 | #49 | Exceptional 7.7% |
| Immigrants | El Salvador | 100.0 /100 | #50 | Exceptional 7.7% |