Immigrants from Serbia vs Lithuanian 4 or more Vehicles in Household
COMPARE
Immigrants from Serbia
Lithuanian
4 or more Vehicles in Household
4 or more Vehicles in Household Comparison
Immigrants from Serbia
Lithuanians
5.0%
4 OR MORE VEHICLES IN HOUSEHOLD
0.0/ 100
METRIC RATING
306th/ 347
METRIC RANK
6.3%
4 OR MORE VEHICLES IN HOUSEHOLD
50.0/ 100
METRIC RATING
174th/ 347
METRIC RANK
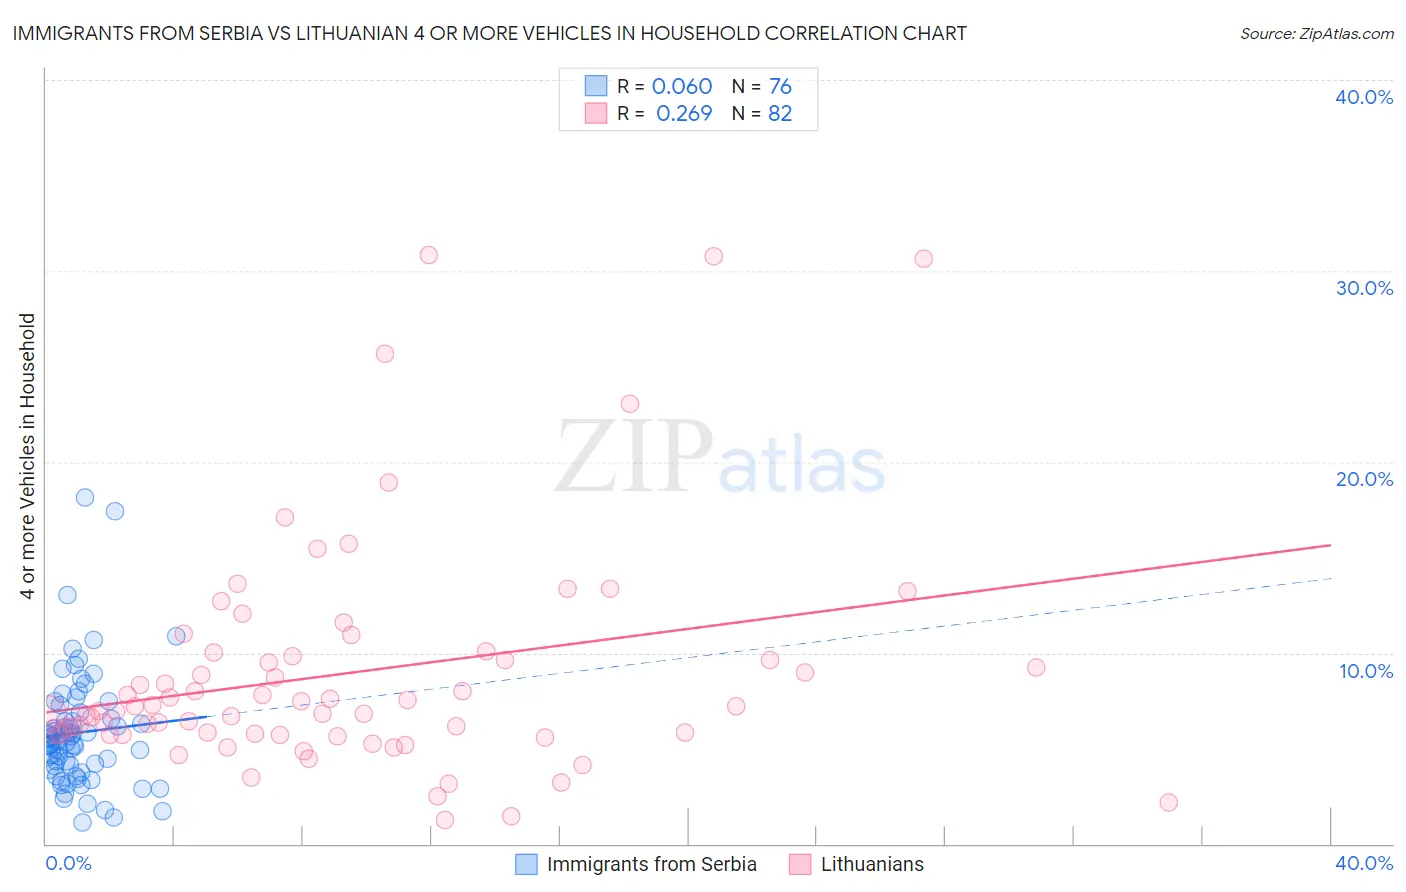
Immigrants from Serbia vs Lithuanian 4 or more Vehicles in Household Correlation Chart
The statistical analysis conducted on geographies consisting of 131,136,431 people shows a slight positive correlation between the proportion of Immigrants from Serbia and percentage of households with 4 or more vehicles available in the United States with a correlation coefficient (R) of 0.060 and weighted average of 5.0%. Similarly, the statistical analysis conducted on geographies consisting of 420,091,012 people shows a weak positive correlation between the proportion of Lithuanians and percentage of households with 4 or more vehicles available in the United States with a correlation coefficient (R) of 0.269 and weighted average of 6.3%, a difference of 26.0%.
4 or more Vehicles in Household Correlation Summary
| Measurement | Immigrants from Serbia | Lithuanian |
| Minimum | 1.1% | 1.3% |
| Maximum | 18.1% | 30.8% |
| Range | 17.0% | 29.6% |
| Mean | 5.8% | 8.9% |
| Median | 5.4% | 7.1% |
| Interquartile 25% (IQ1) | 4.0% | 5.8% |
| Interquartile 75% (IQ3) | 6.7% | 9.8% |
| Interquartile Range (IQR) | 2.7% | 4.1% |
| Standard Deviation (Sample) | 3.1% | 6.0% |
| Standard Deviation (Population) | 3.0% | 6.0% |
Similar Demographics by 4 or more Vehicles in Household
Demographics Similar to Immigrants from Serbia by 4 or more Vehicles in Household
In terms of 4 or more vehicles in household, the demographic groups most similar to Immigrants from Serbia are Cypriot (5.0%, a difference of 0.090%), Somali (5.0%, a difference of 0.090%), Immigrants from Greece (5.1%, a difference of 0.64%), Menominee (5.0%, a difference of 0.94%), and Bahamian (5.1%, a difference of 1.1%).
| Demographics | Rating | Rank | 4 or more Vehicles in Household |
| Immigrants | Ghana | 0.1 /100 | #299 | Tragic 5.2% |
| Immigrants | Morocco | 0.0 /100 | #300 | Tragic 5.1% |
| Immigrants | Zaire | 0.0 /100 | #301 | Tragic 5.1% |
| Bahamians | 0.0 /100 | #302 | Tragic 5.1% |
| Immigrants | Greece | 0.0 /100 | #303 | Tragic 5.1% |
| Cypriots | 0.0 /100 | #304 | Tragic 5.0% |
| Somalis | 0.0 /100 | #305 | Tragic 5.0% |
| Immigrants | Serbia | 0.0 /100 | #306 | Tragic 5.0% |
| Menominee | 0.0 /100 | #307 | Tragic 5.0% |
| Paraguayans | 0.0 /100 | #308 | Tragic 4.9% |
| Immigrants | Somalia | 0.0 /100 | #309 | Tragic 4.9% |
| Moroccans | 0.0 /100 | #310 | Tragic 4.9% |
| Houma | 0.0 /100 | #311 | Tragic 4.9% |
| Albanians | 0.0 /100 | #312 | Tragic 4.8% |
| Immigrants | Israel | 0.0 /100 | #313 | Tragic 4.8% |
Demographics Similar to Lithuanians by 4 or more Vehicles in Household
In terms of 4 or more vehicles in household, the demographic groups most similar to Lithuanians are Slovene (6.3%, a difference of 0.12%), Immigrants from Western Europe (6.3%, a difference of 0.12%), Immigrants from Lebanon (6.3%, a difference of 0.17%), Immigrants from India (6.3%, a difference of 0.20%), and Ukrainian (6.3%, a difference of 0.24%).
| Demographics | Rating | Rank | 4 or more Vehicles in Household |
| Poles | 56.9 /100 | #167 | Average 6.4% |
| Lebanese | 55.8 /100 | #168 | Average 6.4% |
| Estonians | 55.1 /100 | #169 | Average 6.4% |
| Immigrants | Syria | 52.8 /100 | #170 | Average 6.3% |
| Immigrants | India | 51.9 /100 | #171 | Average 6.3% |
| Immigrants | Lebanon | 51.7 /100 | #172 | Average 6.3% |
| Slovenes | 51.1 /100 | #173 | Average 6.3% |
| Lithuanians | 50.0 /100 | #174 | Average 6.3% |
| Immigrants | Western Europe | 48.8 /100 | #175 | Average 6.3% |
| Ukrainians | 47.6 /100 | #176 | Average 6.3% |
| Slovaks | 46.9 /100 | #177 | Average 6.3% |
| Belizeans | 44.5 /100 | #178 | Average 6.3% |
| Immigrants | Japan | 43.1 /100 | #179 | Average 6.3% |
| Syrians | 42.0 /100 | #180 | Average 6.3% |
| Yugoslavians | 41.1 /100 | #181 | Average 6.3% |