Immigrants from Serbia vs Lithuanian 10th Grade

COMPARE

Immigrants from Serbia
Race
Ancestry
AfghanAfricanAlaska NativeAlaskan AthabascanAlbanianAleutAlsatianAmericanApacheArabArapahoArgentineanArmenianAssyrian/Chaldean/SyriacAustralianAustrianBahamianBangladeshiBarbadianBasqueBelgianBelizeanBermudanBhutaneseBlackfeetBolivianBrazilianBritishBritish West IndianBulgarianBurmeseCajunCambodianCanadianCape VerdeanCarpatho RusynCelticCentral AmericanCentral American IndianCherokeeCheyenneChickasawChileanChineseChippewaChoctawColombianColvilleComancheCosta RicanCreeCreekCroatianCrowCubanCypriotCzechCzechoslovakianDanishDelawareDominicanDutchDutch West IndianEastern EuropeanEcuadorianEgyptianEnglishEstonianEthiopianEuropeanFijianFilipinoFinnishFrenchFrench American IndianFrench CanadianGermanGerman RussianGhanaianGreekGuamanian/ChamorroGuatemalanGuyaneseHaitianHmongHonduranHopiHoumaHungarianIcelanderIndian (Asian)IndonesianInupiatIranianIraqiIrishIroquoisIsraeliItalianJamaicanJapaneseJordanianKenyanKiowaKoreanLaotianLatvianLebaneseLiberianLumbeeLuxembourgerMacedonianMalaysianMalteseMarshalleseMenomineeMexicanMexican American IndianMongolianMoroccanNative HawaiianNavajoNepaleseNew ZealanderNicaraguanNigerianNorthern EuropeanNorwegianOkinawanOsageOttawaPaiutePakistaniPalestinianPanamanianParaguayanPennsylvania GermanPeruvianPimaPolishPortuguesePotawatomiPuebloPuerto RicanPuget Sound SalishRomanianRussianSalvadoranSamoanScandinavianScotch-IrishScottishSeminoleSenegaleseSerbianShoshoneSierra LeoneanSiouxSlavicSlovakSloveneSomaliSouth AfricanSouth AmericanSouth American IndianSoviet UnionSpaniardSpanishSpanish AmericanSpanish American IndianSri LankanSubsaharan AfricanSudaneseSwedishSwissSyrianTaiwaneseThaiTlingit-HaidaTohono O'OdhamTonganTrinidadian and TobagonianTsimshianTurkishU.S. Virgin IslanderUgandanUkrainianUruguayanUteVenezuelanVietnameseWelshWest IndianYakamaYaquiYugoslavianYumanYup'ikZimbabwean
Immigration
NonimmigrantsImmigrantsAfghanistanAfricaAlbaniaArgentinaArmeniaAsiaAustraliaAustriaBahamasBangladeshBarbadosBelarusBelgiumBelizeBoliviaBosnia and HerzegovinaBrazilBulgariaBurma/MyanmarCabo VerdeCambodiaCameroonCanadaCaribbeanCentral AmericaChileChinaColombiaCongoCosta RicaCroatiaCubaCzechoslovakiaDenmarkDominicaDominican RepublicEastern AfricaEastern AsiaEastern EuropeEcuadorEgyptEl SalvadorEnglandEritreaEthiopiaEuropeFijiFranceGermanyGhanaGreeceGrenadaGuatemalaGuyanaHaitiHondurasHong KongHungaryIndiaIndonesiaIranIraqIrelandIsraelItalyJamaicaJapanJordanKazakhstanKenyaKoreaKuwaitLaosLatin AmericaLatviaLebanonLiberiaLithuaniaMalaysiaMexicoMicronesiaMiddle AfricaMoldovaMoroccoNepalNetherlandsNicaraguaNigeriaNorth AmericaNorth MacedoniaNorthern AfricaNorthern EuropeNorwayOceaniaPakistanPanamaPeruPhilippinesPolandPortugalRomaniaRussiaSaudi ArabiaScotlandSenegalSerbiaSierra LeoneSingaporeSomaliaSouth AfricaSouth AmericaSouth Central AsiaSouth Eastern AsiaSouthern EuropeSpainSri LankaSt. Vincent and the GrenadinesSudanSwedenSwitzerlandSyriaTaiwanThailandTrinidad and TobagoTurkeyUgandaUkraineUruguayUzbekistanVenezuelaVietnamWest IndiesWestern AfricaWestern AsiaWestern EuropeYemenZaireZimbabweAzores
Lithuanian
Race
Ancestry
AfghanAfricanAlaska NativeAlaskan AthabascanAlbanianAleutAlsatianAmericanApacheArabArapahoArgentineanArmenianAssyrian/Chaldean/SyriacAustralianAustrianBahamianBangladeshiBarbadianBasqueBelgianBelizeanBermudanBhutaneseBlackfeetBolivianBrazilianBritishBritish West IndianBulgarianBurmeseCajunCambodianCanadianCape VerdeanCarpatho RusynCelticCentral AmericanCentral American IndianCherokeeCheyenneChickasawChileanChineseChippewaChoctawColombianColvilleComancheCosta RicanCreeCreekCroatianCrowCubanCypriotCzechCzechoslovakianDanishDelawareDominicanDutchDutch West IndianEastern EuropeanEcuadorianEgyptianEnglishEstonianEthiopianEuropeanFijianFilipinoFinnishFrenchFrench American IndianFrench CanadianGermanGerman RussianGhanaianGreekGuamanian/ChamorroGuatemalanGuyaneseHaitianHmongHonduranHopiHoumaHungarianIcelanderIndian (Asian)IndonesianInupiatIranianIraqiIrishIroquoisIsraeliItalianJamaicanJapaneseJordanianKenyanKiowaKoreanLaotianLatvianLebaneseLiberianLithuanianLumbeeLuxembourgerMacedonianMalaysianMalteseMarshalleseMenomineeMexicanMexican American IndianMongolianMoroccanNative HawaiianNavajoNepaleseNew ZealanderNicaraguanNigerianNorthern EuropeanNorwegianOkinawanOsageOttawaPaiutePakistaniPalestinianPanamanianParaguayanPennsylvania GermanPeruvianPimaPolishPortuguesePotawatomiPuebloPuerto RicanPuget Sound SalishRomanianRussianSalvadoranSamoanScandinavianScotch-IrishScottishSeminoleSenegaleseSerbianShoshoneSierra LeoneanSiouxSlavicSlovakSloveneSomaliSouth AfricanSouth AmericanSouth American IndianSoviet UnionSpaniardSpanishSpanish AmericanSpanish American IndianSri LankanSubsaharan AfricanSudaneseSwedishSwissSyrianTaiwaneseThaiTlingit-HaidaTohono O'OdhamTonganTrinidadian and TobagonianTsimshianTurkishU.S. Virgin IslanderUgandanUkrainianUruguayanUteVenezuelanVietnameseWelshWest IndianYakamaYaquiYugoslavianYumanYup'ikZimbabwean
Immigration
NonimmigrantsImmigrantsAfghanistanAfricaAlbaniaArgentinaArmeniaAsiaAustraliaAustriaBahamasBangladeshBarbadosBelarusBelgiumBelizeBoliviaBosnia and HerzegovinaBrazilBulgariaBurma/MyanmarCabo VerdeCambodiaCameroonCanadaCaribbeanCentral AmericaChileChinaColombiaCongoCosta RicaCroatiaCubaCzechoslovakiaDenmarkDominicaDominican RepublicEastern AfricaEastern AsiaEastern EuropeEcuadorEgyptEl SalvadorEnglandEritreaEthiopiaEuropeFijiFranceGermanyGhanaGreeceGrenadaGuatemalaGuyanaHaitiHondurasHong KongHungaryIndiaIndonesiaIranIraqIrelandIsraelItalyJamaicaJapanJordanKazakhstanKenyaKoreaKuwaitLaosLatin AmericaLatviaLebanonLiberiaLithuaniaMalaysiaMexicoMicronesiaMiddle AfricaMoldovaMoroccoNepalNetherlandsNicaraguaNigeriaNorth AmericaNorth MacedoniaNorthern AfricaNorthern EuropeNorwayOceaniaPakistanPanamaPeruPhilippinesPolandPortugalRomaniaRussiaSaudi ArabiaScotlandSenegalSierra LeoneSingaporeSomaliaSouth AfricaSouth AmericaSouth Central AsiaSouth Eastern AsiaSouthern EuropeSpainSri LankaSt. Vincent and the GrenadinesSudanSwedenSwitzerlandSyriaTaiwanThailandTrinidad and TobagoTurkeyUgandaUkraineUruguayUzbekistanVenezuelaVietnamWest IndiesWestern AfricaWestern AsiaWestern EuropeYemenZaireZimbabweAzores
10th Grade
Income
Poverty
Unemployment
Labor Participation
Family Structure
Vehicle Availability
Education Level
Disability

10th Grade Comparison

Immigrants from Serbia

Lithuanians

Exceptional
Exceptional
94.5%
10TH GRADE
97.4/ 100
METRIC RATING
106th/ 347
METRIC RANK
95.8%
10TH GRADE
100.0/ 100
METRIC RATING
8th/ 347
METRIC RANK

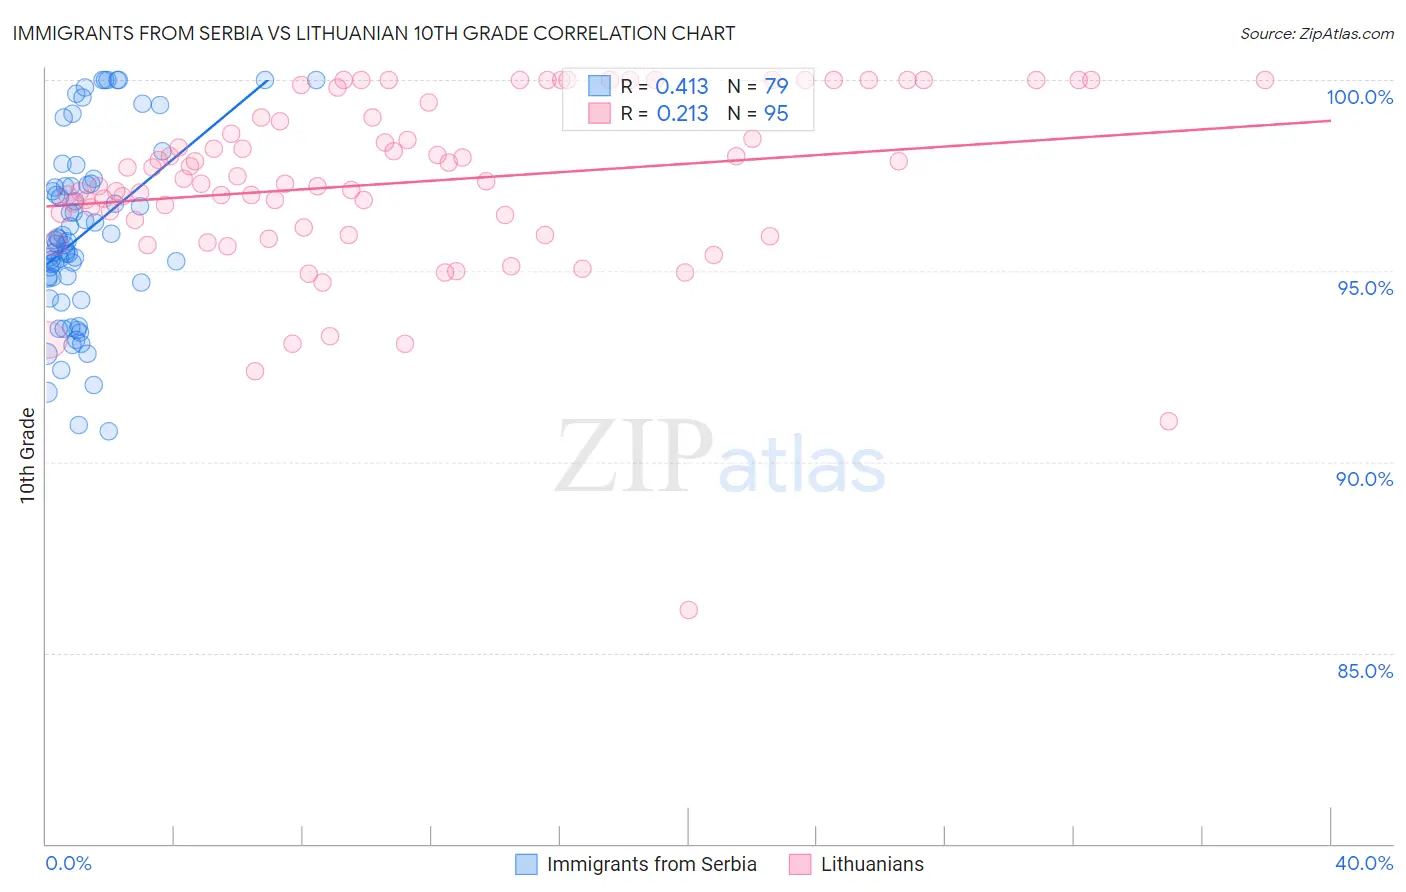
Immigrants from Serbia vs Lithuanian 10th Grade Correlation Chart

The statistical analysis conducted on geographies consisting of 131,729,423 people shows a moderate positive correlation between the proportion of Immigrants from Serbia and percentage of population with at least 10th grade education in the United States with a correlation coefficient (R) of 0.413 and weighted average of 94.5%. Similarly, the statistical analysis conducted on geographies consisting of 421,947,524 people shows a weak positive correlation between the proportion of Lithuanians and percentage of population with at least 10th grade education in the United States with a correlation coefficient (R) of 0.213 and weighted average of 95.8%, a difference of 1.4%.
Immigrants from Serbia vs Lithuanian 10th Grade

10th Grade Correlation Summary

MeasurementImmigrants from SerbiaLithuanian
Minimum90.8%86.1%
Maximum100.0%100.0%
Range9.2%13.9%
Mean96.0%97.3%
Median95.8%97.4%
Interquartile 25% (IQ1)94.7%96.1%
Interquartile 75% (IQ3)97.3%99.0%
Interquartile Range (IQR)2.6%2.9%
Standard Deviation (Sample)2.3%2.3%
Standard Deviation (Population)2.3%2.3%

Similar Demographics by 10th Grade

Demographics Similar to Immigrants from Serbia by 10th Grade

In terms of 10th grade, the demographic groups most similar to Immigrants from Serbia are Immigrants from Turkey (94.5%, a difference of 0.0%), Immigrants from Croatia (94.5%, a difference of 0.0%), Immigrants from Europe (94.5%, a difference of 0.010%), Immigrants from Romania (94.5%, a difference of 0.010%), and Immigrants from North Macedonia (94.5%, a difference of 0.010%).
DemographicsRating | Rank10th Grade
Immigrants | France
97.9
/100
|
#99
Exceptional
94.5%
Immigrants | South Central Asia
97.8
/100
|
#100
Exceptional
94.5%
Syrians
97.7
/100
|
#101
Exceptional
94.5%
Cambodians
97.6
/100
|
#102
Exceptional
94.5%
Immigrants | Europe
97.5
/100
|
#103
Exceptional
94.5%
Immigrants | Romania
97.5
/100
|
#104
Exceptional
94.5%
Immigrants | Turkey
97.4
/100
|
#105
Exceptional
94.5%
Immigrants | Serbia
97.4
/100
|
#106
Exceptional
94.5%
Immigrants | Croatia
97.4
/100
|
#107
Exceptional
94.5%
Immigrants | North Macedonia
97.2
/100
|
#108
Exceptional
94.5%
Immigrants | Norway
97.2
/100
|
#109
Exceptional
94.5%
Burmese
97.1
/100
|
#110
Exceptional
94.5%
Immigrants | Zimbabwe
96.8
/100
|
#111
Exceptional
94.4%
Immigrants | Kuwait
96.8
/100
|
#112
Exceptional
94.4%
Palestinians
96.5
/100
|
#113
Exceptional
94.4%

Demographics Similar to Lithuanians by 10th Grade

In terms of 10th grade, the demographic groups most similar to Lithuanians are German (95.8%, a difference of 0.010%), Polish (95.8%, a difference of 0.030%), Finnish (95.8%, a difference of 0.060%), Croatian (95.7%, a difference of 0.080%), and Danish (95.7%, a difference of 0.11%).
DemographicsRating | Rank10th Grade
Norwegians
100.0
/100
|
#1
Exceptional
96.2%
Slovaks
100.0
/100
|
#2
Exceptional
96.0%
Slovenes
100.0
/100
|
#3
Exceptional
95.9%
Swedes
100.0
/100
|
#4
Exceptional
95.9%
Carpatho Rusyns
100.0
/100
|
#5
Exceptional
95.9%
Poles
100.0
/100
|
#6
Exceptional
95.8%
Germans
100.0
/100
|
#7
Exceptional
95.8%
Lithuanians
100.0
/100
|
#8
Exceptional
95.8%
Finns
100.0
/100
|
#9
Exceptional
95.8%
Croatians
100.0
/100
|
#10
Exceptional
95.7%
Danes
100.0
/100
|
#11
Exceptional
95.7%
Tlingit-Haida
100.0
/100
|
#12
Exceptional
95.7%
English
100.0
/100
|
#13
Exceptional
95.6%
Tsimshian
100.0
/100
|
#14
Exceptional
95.6%
Irish
100.0
/100
|
#15
Exceptional
95.6%