Immigrants from Serbia vs Immigrants from Canada 4 or more Vehicles in Household
COMPARE
Immigrants from Serbia
Immigrants from Canada
4 or more Vehicles in Household
4 or more Vehicles in Household Comparison
Immigrants from Serbia
Immigrants from Canada
5.0%
4 OR MORE VEHICLES IN HOUSEHOLD
0.0/ 100
METRIC RATING
306th/ 347
METRIC RANK
6.5%
4 OR MORE VEHICLES IN HOUSEHOLD
78.6/ 100
METRIC RATING
143rd/ 347
METRIC RANK
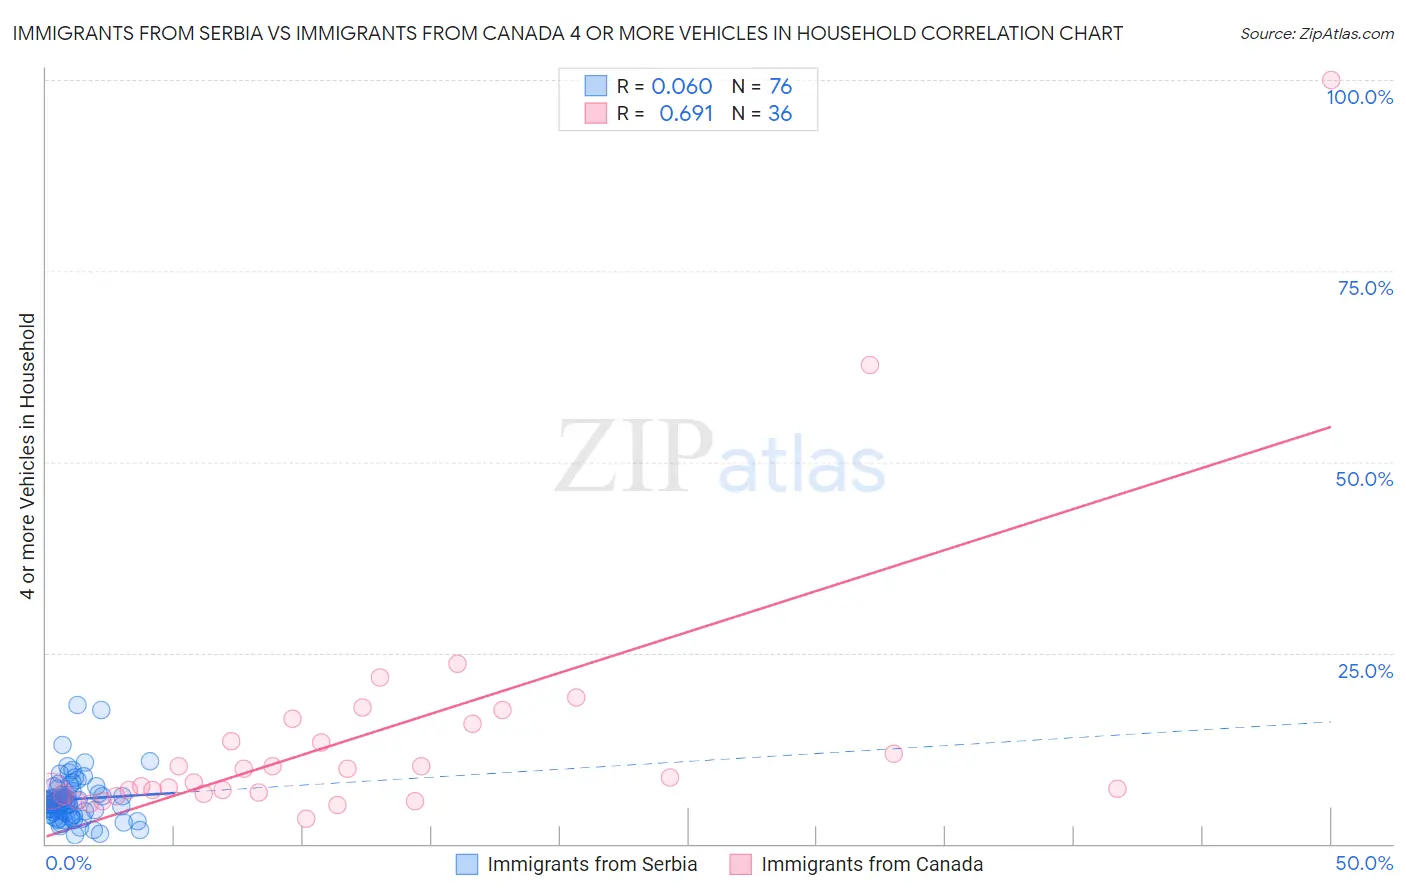
Immigrants from Serbia vs Immigrants from Canada 4 or more Vehicles in Household Correlation Chart
The statistical analysis conducted on geographies consisting of 131,136,431 people shows a slight positive correlation between the proportion of Immigrants from Serbia and percentage of households with 4 or more vehicles available in the United States with a correlation coefficient (R) of 0.060 and weighted average of 5.0%. Similarly, the statistical analysis conducted on geographies consisting of 457,196,725 people shows a significant positive correlation between the proportion of Immigrants from Canada and percentage of households with 4 or more vehicles available in the United States with a correlation coefficient (R) of 0.691 and weighted average of 6.5%, a difference of 30.1%.
4 or more Vehicles in Household Correlation Summary
| Measurement | Immigrants from Serbia | Immigrants from Canada |
| Minimum | 1.1% | 3.3% |
| Maximum | 18.1% | 100.0% |
| Range | 17.0% | 96.7% |
| Mean | 5.8% | 14.1% |
| Median | 5.4% | 8.4% |
| Interquartile 25% (IQ1) | 4.0% | 6.7% |
| Interquartile 75% (IQ3) | 6.7% | 14.6% |
| Interquartile Range (IQR) | 2.7% | 7.9% |
| Standard Deviation (Sample) | 3.1% | 17.9% |
| Standard Deviation (Population) | 3.0% | 17.6% |
Similar Demographics by 4 or more Vehicles in Household
Demographics Similar to Immigrants from Serbia by 4 or more Vehicles in Household
In terms of 4 or more vehicles in household, the demographic groups most similar to Immigrants from Serbia are Cypriot (5.0%, a difference of 0.090%), Somali (5.0%, a difference of 0.090%), Immigrants from Greece (5.1%, a difference of 0.64%), Menominee (5.0%, a difference of 0.94%), and Bahamian (5.1%, a difference of 1.1%).
| Demographics | Rating | Rank | 4 or more Vehicles in Household |
| Immigrants | Ghana | 0.1 /100 | #299 | Tragic 5.2% |
| Immigrants | Morocco | 0.0 /100 | #300 | Tragic 5.1% |
| Immigrants | Zaire | 0.0 /100 | #301 | Tragic 5.1% |
| Bahamians | 0.0 /100 | #302 | Tragic 5.1% |
| Immigrants | Greece | 0.0 /100 | #303 | Tragic 5.1% |
| Cypriots | 0.0 /100 | #304 | Tragic 5.0% |
| Somalis | 0.0 /100 | #305 | Tragic 5.0% |
| Immigrants | Serbia | 0.0 /100 | #306 | Tragic 5.0% |
| Menominee | 0.0 /100 | #307 | Tragic 5.0% |
| Paraguayans | 0.0 /100 | #308 | Tragic 4.9% |
| Immigrants | Somalia | 0.0 /100 | #309 | Tragic 4.9% |
| Moroccans | 0.0 /100 | #310 | Tragic 4.9% |
| Houma | 0.0 /100 | #311 | Tragic 4.9% |
| Albanians | 0.0 /100 | #312 | Tragic 4.8% |
| Immigrants | Israel | 0.0 /100 | #313 | Tragic 4.8% |
Demographics Similar to Immigrants from Canada by 4 or more Vehicles in Household
In terms of 4 or more vehicles in household, the demographic groups most similar to Immigrants from Canada are Immigrants from North America (6.5%, a difference of 0.020%), Croatian (6.5%, a difference of 0.11%), Immigrants from Iraq (6.5%, a difference of 0.13%), Australian (6.6%, a difference of 0.33%), and Slavic (6.6%, a difference of 0.46%).
| Demographics | Rating | Rank | 4 or more Vehicles in Household |
| Luxembourgers | 86.4 /100 | #136 | Excellent 6.6% |
| French Canadians | 85.4 /100 | #137 | Excellent 6.6% |
| Italians | 84.5 /100 | #138 | Excellent 6.6% |
| Jordanians | 82.1 /100 | #139 | Excellent 6.6% |
| Slavs | 81.6 /100 | #140 | Excellent 6.6% |
| Australians | 80.8 /100 | #141 | Excellent 6.6% |
| Immigrants | Iraq | 79.4 /100 | #142 | Good 6.5% |
| Immigrants | Canada | 78.6 /100 | #143 | Good 6.5% |
| Immigrants | North America | 78.5 /100 | #144 | Good 6.5% |
| Croatians | 77.8 /100 | #145 | Good 6.5% |
| Immigrants | Costa Rica | 74.4 /100 | #146 | Good 6.5% |
| Immigrants | Iran | 73.9 /100 | #147 | Good 6.5% |
| Immigrants | Jordan | 73.7 /100 | #148 | Good 6.5% |
| Greeks | 73.6 /100 | #149 | Good 6.5% |
| New Zealanders | 73.3 /100 | #150 | Good 6.5% |