Immigrants from Poland vs Delaware Median Male Earnings
COMPARE
Immigrants from Poland
Delaware
Median Male Earnings
Median Male Earnings Comparison
Immigrants from Poland
Delaware
$58,452
MEDIAN MALE EARNINGS
98.0/ 100
METRIC RATING
99th/ 347
METRIC RANK
$52,412
MEDIAN MALE EARNINGS
11.5/ 100
METRIC RATING
210th/ 347
METRIC RANK
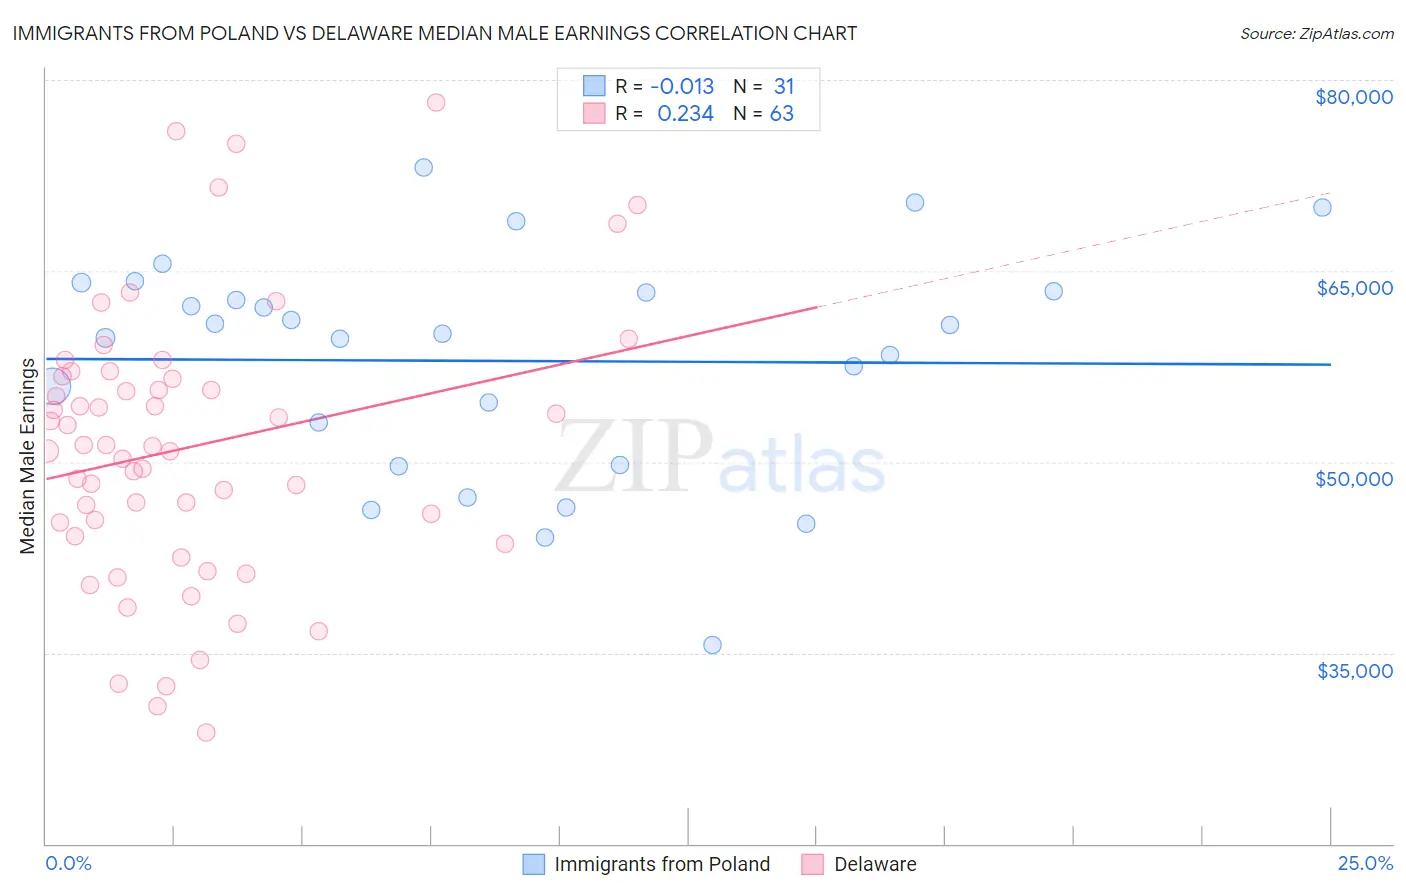
Immigrants from Poland vs Delaware Median Male Earnings Correlation Chart
The statistical analysis conducted on geographies consisting of 304,780,508 people shows no correlation between the proportion of Immigrants from Poland and median male earnings in the United States with a correlation coefficient (R) of -0.013 and weighted average of $58,452. Similarly, the statistical analysis conducted on geographies consisting of 96,215,096 people shows a weak positive correlation between the proportion of Delaware and median male earnings in the United States with a correlation coefficient (R) of 0.234 and weighted average of $52,412, a difference of 11.5%.
Median Male Earnings Correlation Summary
| Measurement | Immigrants from Poland | Delaware |
| Minimum | $35,574 | $28,768 |
| Maximum | $73,128 | $78,250 |
| Range | $37,554 | $49,482 |
| Mean | $57,933 | $51,144 |
| Median | $60,075 | $51,243 |
| Interquartile 25% (IQ1) | $49,798 | $44,148 |
| Interquartile 75% (IQ3) | $63,413 | $56,755 |
| Interquartile Range (IQR) | $13,615 | $12,606 |
| Standard Deviation (Sample) | $8,867 | $10,850 |
| Standard Deviation (Population) | $8,722 | $10,763 |
Similar Demographics by Median Male Earnings
Demographics Similar to Immigrants from Poland by Median Male Earnings
In terms of median male earnings, the demographic groups most similar to Immigrants from Poland are Assyrian/Chaldean/Syriac ($58,437, a difference of 0.030%), Jordanian ($58,500, a difference of 0.080%), Immigrants from Brazil ($58,324, a difference of 0.22%), Northern European ($58,588, a difference of 0.23%), and Albanian ($58,680, a difference of 0.39%).
| Demographics | Rating | Rank | Median Male Earnings |
| Immigrants | Kazakhstan | 99.1 /100 | #92 | Exceptional $59,278 |
| Immigrants | Southern Europe | 99.0 /100 | #93 | Exceptional $59,217 |
| Immigrants | North Macedonia | 99.0 /100 | #94 | Exceptional $59,189 |
| Immigrants | Lebanon | 98.6 /100 | #95 | Exceptional $58,835 |
| Albanians | 98.4 /100 | #96 | Exceptional $58,680 |
| Northern Europeans | 98.2 /100 | #97 | Exceptional $58,588 |
| Jordanians | 98.1 /100 | #98 | Exceptional $58,500 |
| Immigrants | Poland | 98.0 /100 | #99 | Exceptional $58,452 |
| Assyrians/Chaldeans/Syriacs | 97.9 /100 | #100 | Exceptional $58,437 |
| Immigrants | Brazil | 97.7 /100 | #101 | Exceptional $58,324 |
| Syrians | 97.4 /100 | #102 | Exceptional $58,187 |
| Poles | 97.3 /100 | #103 | Exceptional $58,139 |
| Armenians | 97.3 /100 | #104 | Exceptional $58,134 |
| Immigrants | Western Asia | 97.3 /100 | #105 | Exceptional $58,131 |
| Immigrants | Northern Africa | 96.9 /100 | #106 | Exceptional $58,008 |
Demographics Similar to Delaware by Median Male Earnings
In terms of median male earnings, the demographic groups most similar to Delaware are Tlingit-Haida ($52,409, a difference of 0.010%), Bermudan ($52,465, a difference of 0.10%), Cajun ($52,325, a difference of 0.17%), Venezuelan ($52,510, a difference of 0.19%), and Native Hawaiian ($52,306, a difference of 0.20%).
| Demographics | Rating | Rank | Median Male Earnings |
| Panamanians | 16.5 /100 | #203 | Poor $52,835 |
| Ghanaians | 16.1 /100 | #204 | Poor $52,810 |
| Immigrants | Colombia | 15.0 /100 | #205 | Poor $52,725 |
| Immigrants | Iraq | 14.5 /100 | #206 | Poor $52,681 |
| Vietnamese | 12.7 /100 | #207 | Poor $52,525 |
| Venezuelans | 12.5 /100 | #208 | Poor $52,510 |
| Bermudans | 12.1 /100 | #209 | Poor $52,465 |
| Delaware | 11.5 /100 | #210 | Poor $52,412 |
| Tlingit-Haida | 11.5 /100 | #211 | Poor $52,409 |
| Cajuns | 10.7 /100 | #212 | Poor $52,325 |
| Native Hawaiians | 10.5 /100 | #213 | Poor $52,306 |
| Immigrants | Nonimmigrants | 9.3 /100 | #214 | Tragic $52,170 |
| Immigrants | Cameroon | 8.9 /100 | #215 | Tragic $52,119 |
| Immigrants | Venezuela | 8.3 /100 | #216 | Tragic $52,041 |
| Nigerians | 8.3 /100 | #217 | Tragic $52,039 |