Immigrants from South Africa vs Trinidadian and Tobagonian 4 or more Vehicles in Household
COMPARE
Immigrants from South Africa
Trinidadian and Tobagonian
4 or more Vehicles in Household
4 or more Vehicles in Household Comparison
Immigrants from South Africa
Trinidadians and Tobagonians
6.2%
4 OR MORE VEHICLES IN HOUSEHOLD
35.4/ 100
METRIC RATING
187th/ 347
METRIC RANK
4.3%
4 OR MORE VEHICLES IN HOUSEHOLD
0.0/ 100
METRIC RATING
328th/ 347
METRIC RANK
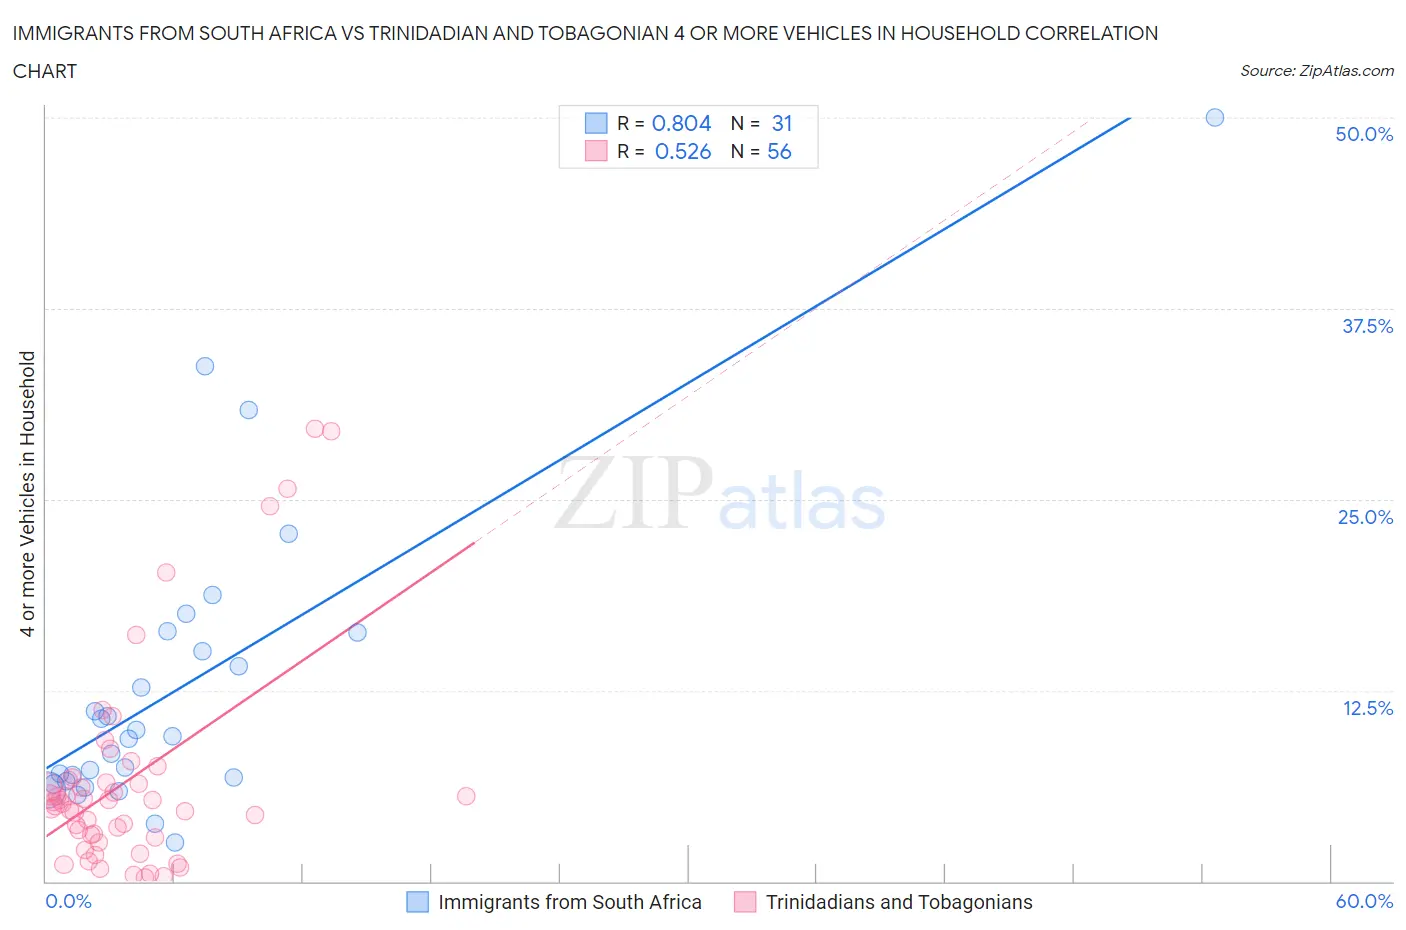
Immigrants from South Africa vs Trinidadian and Tobagonian 4 or more Vehicles in Household Correlation Chart
The statistical analysis conducted on geographies consisting of 232,301,901 people shows a very strong positive correlation between the proportion of Immigrants from South Africa and percentage of households with 4 or more vehicles available in the United States with a correlation coefficient (R) of 0.804 and weighted average of 6.2%. Similarly, the statistical analysis conducted on geographies consisting of 218,579,847 people shows a substantial positive correlation between the proportion of Trinidadians and Tobagonians and percentage of households with 4 or more vehicles available in the United States with a correlation coefficient (R) of 0.526 and weighted average of 4.3%, a difference of 46.4%.
4 or more Vehicles in Household Correlation Summary
| Measurement | Immigrants from South Africa | Trinidadian and Tobagonian |
| Minimum | 2.6% | 0.23% |
| Maximum | 50.0% | 29.6% |
| Range | 47.4% | 29.4% |
| Mean | 12.8% | 6.6% |
| Median | 9.5% | 5.1% |
| Interquartile 25% (IQ1) | 6.6% | 3.0% |
| Interquartile 75% (IQ3) | 16.3% | 6.6% |
| Interquartile Range (IQR) | 9.7% | 3.6% |
| Standard Deviation (Sample) | 10.0% | 6.8% |
| Standard Deviation (Population) | 9.9% | 6.8% |
Similar Demographics by 4 or more Vehicles in Household
Demographics Similar to Immigrants from South Africa by 4 or more Vehicles in Household
In terms of 4 or more vehicles in household, the demographic groups most similar to Immigrants from South Africa are Kiowa (6.2%, a difference of 0.070%), Immigrants from Northern Europe (6.2%, a difference of 0.15%), Thai (6.2%, a difference of 0.17%), Iraqi (6.2%, a difference of 0.21%), and Immigrants from Burma/Myanmar (6.2%, a difference of 0.23%).
| Demographics | Rating | Rank | 4 or more Vehicles in Household |
| Syrians | 42.0 /100 | #180 | Average 6.3% |
| Yugoslavians | 41.1 /100 | #181 | Average 6.3% |
| South American Indians | 40.7 /100 | #182 | Average 6.3% |
| Immigrants | Burma/Myanmar | 37.5 /100 | #183 | Fair 6.2% |
| Iraqis | 37.3 /100 | #184 | Fair 6.2% |
| Thais | 36.9 /100 | #185 | Fair 6.2% |
| Immigrants | Northern Europe | 36.8 /100 | #186 | Fair 6.2% |
| Immigrants | South Africa | 35.4 /100 | #187 | Fair 6.2% |
| Kiowa | 34.7 /100 | #188 | Fair 6.2% |
| Immigrants | Eastern Asia | 33.3 /100 | #189 | Fair 6.2% |
| South Africans | 32.2 /100 | #190 | Fair 6.2% |
| Inupiat | 30.7 /100 | #191 | Fair 6.2% |
| Romanians | 30.7 /100 | #192 | Fair 6.2% |
| Immigrants | Kuwait | 28.0 /100 | #193 | Fair 6.2% |
| Immigrants | Sweden | 27.0 /100 | #194 | Fair 6.2% |
Demographics Similar to Trinidadians and Tobagonians by 4 or more Vehicles in Household
In terms of 4 or more vehicles in household, the demographic groups most similar to Trinidadians and Tobagonians are Immigrants from Senegal (4.2%, a difference of 0.27%), Immigrants from Ecuador (4.2%, a difference of 0.47%), West Indian (4.2%, a difference of 0.73%), Senegalese (4.3%, a difference of 1.6%), and Immigrants from Dominica (4.2%, a difference of 1.6%).
| Demographics | Rating | Rank | 4 or more Vehicles in Household |
| Ecuadorians | 0.0 /100 | #321 | Tragic 4.5% |
| Immigrants | Yemen | 0.0 /100 | #322 | Tragic 4.5% |
| Immigrants | Caribbean | 0.0 /100 | #323 | Tragic 4.4% |
| Soviet Union | 0.0 /100 | #324 | Tragic 4.4% |
| Immigrants | Jamaica | 0.0 /100 | #325 | Tragic 4.4% |
| Cape Verdeans | 0.0 /100 | #326 | Tragic 4.4% |
| Senegalese | 0.0 /100 | #327 | Tragic 4.3% |
| Trinidadians and Tobagonians | 0.0 /100 | #328 | Tragic 4.3% |
| Immigrants | Senegal | 0.0 /100 | #329 | Tragic 4.2% |
| Immigrants | Ecuador | 0.0 /100 | #330 | Tragic 4.2% |
| West Indians | 0.0 /100 | #331 | Tragic 4.2% |
| Immigrants | Dominica | 0.0 /100 | #332 | Tragic 4.2% |
| Immigrants | Albania | 0.0 /100 | #333 | Tragic 4.1% |
| Immigrants | Trinidad and Tobago | 0.0 /100 | #334 | Tragic 4.1% |
| Barbadians | 0.0 /100 | #335 | Tragic 3.9% |