Immigrants from Oceania vs Australian Bachelor's Degree
COMPARE
Immigrants from Oceania
Australian
Bachelor's Degree
Bachelor's Degree Comparison
Immigrants from Oceania
Australians
37.3%
BACHELOR'S DEGREE
37.3/ 100
METRIC RATING
188th/ 347
METRIC RANK
44.0%
BACHELOR'S DEGREE
99.9/ 100
METRIC RATING
59th/ 347
METRIC RANK
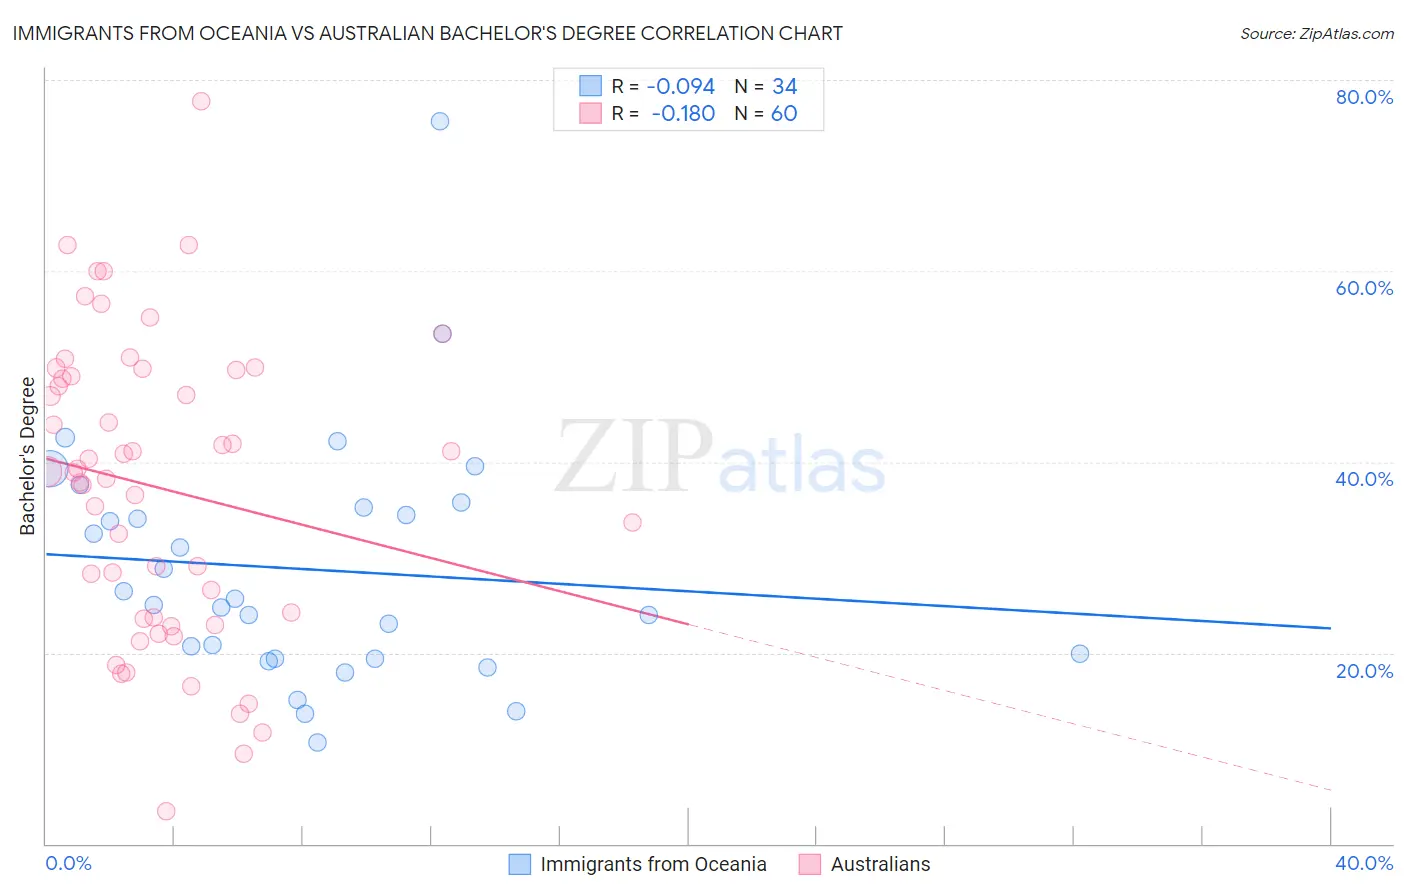
Immigrants from Oceania vs Australian Bachelor's Degree Correlation Chart
The statistical analysis conducted on geographies consisting of 305,508,659 people shows a slight negative correlation between the proportion of Immigrants from Oceania and percentage of population with at least bachelor's degree education in the United States with a correlation coefficient (R) of -0.094 and weighted average of 37.3%. Similarly, the statistical analysis conducted on geographies consisting of 224,140,970 people shows a poor negative correlation between the proportion of Australians and percentage of population with at least bachelor's degree education in the United States with a correlation coefficient (R) of -0.180 and weighted average of 44.0%, a difference of 17.7%.
Bachelor's Degree Correlation Summary
| Measurement | Immigrants from Oceania | Australian |
| Minimum | 10.7% | 3.4% |
| Maximum | 75.7% | 77.7% |
| Range | 65.0% | 74.3% |
| Mean | 28.7% | 37.3% |
| Median | 25.4% | 38.9% |
| Interquartile 25% (IQ1) | 19.4% | 23.7% |
| Interquartile 75% (IQ3) | 35.2% | 49.3% |
| Interquartile Range (IQR) | 15.8% | 25.7% |
| Standard Deviation (Sample) | 12.9% | 15.6% |
| Standard Deviation (Population) | 12.7% | 15.5% |
Similar Demographics by Bachelor's Degree
Demographics Similar to Immigrants from Oceania by Bachelor's Degree
In terms of bachelor's degree, the demographic groups most similar to Immigrants from Oceania are Slovak (37.3%, a difference of 0.050%), English (37.4%, a difference of 0.24%), Norwegian (37.5%, a difference of 0.32%), Swiss (37.2%, a difference of 0.35%), and Nigerian (37.2%, a difference of 0.37%).
| Demographics | Rating | Rank | Bachelor's Degree |
| Immigrants | Senegal | 43.8 /100 | #181 | Average 37.6% |
| Immigrants | Bosnia and Herzegovina | 43.4 /100 | #182 | Average 37.6% |
| Senegalese | 42.2 /100 | #183 | Average 37.5% |
| Scandinavians | 41.7 /100 | #184 | Average 37.5% |
| Immigrants | Peru | 41.3 /100 | #185 | Average 37.5% |
| Norwegians | 40.4 /100 | #186 | Average 37.5% |
| English | 39.7 /100 | #187 | Fair 37.4% |
| Immigrants | Oceania | 37.3 /100 | #188 | Fair 37.3% |
| Slovaks | 36.9 /100 | #189 | Fair 37.3% |
| Swiss | 34.1 /100 | #190 | Fair 37.2% |
| Nigerians | 33.9 /100 | #191 | Fair 37.2% |
| Immigrants | Vietnam | 32.1 /100 | #192 | Fair 37.1% |
| Yugoslavians | 31.5 /100 | #193 | Fair 37.1% |
| Belgians | 29.9 /100 | #194 | Fair 37.0% |
| Koreans | 29.8 /100 | #195 | Fair 37.0% |
Demographics Similar to Australians by Bachelor's Degree
In terms of bachelor's degree, the demographic groups most similar to Australians are New Zealander (44.0%, a difference of 0.010%), Immigrants from Czechoslovakia (44.0%, a difference of 0.10%), Paraguayan (44.0%, a difference of 0.16%), Immigrants from Serbia (44.1%, a difference of 0.34%), and Immigrants from Austria (44.2%, a difference of 0.53%).
| Demographics | Rating | Rank | Bachelor's Degree |
| Immigrants | Spain | 99.9 /100 | #52 | Exceptional 44.3% |
| Immigrants | Asia | 99.9 /100 | #53 | Exceptional 44.3% |
| Immigrants | Austria | 99.9 /100 | #54 | Exceptional 44.2% |
| Immigrants | Bolivia | 99.9 /100 | #55 | Exceptional 44.2% |
| Immigrants | Serbia | 99.9 /100 | #56 | Exceptional 44.1% |
| Paraguayans | 99.9 /100 | #57 | Exceptional 44.0% |
| Immigrants | Czechoslovakia | 99.9 /100 | #58 | Exceptional 44.0% |
| Australians | 99.9 /100 | #59 | Exceptional 44.0% |
| New Zealanders | 99.9 /100 | #60 | Exceptional 44.0% |
| South Africans | 99.8 /100 | #61 | Exceptional 43.6% |
| Immigrants | Kazakhstan | 99.8 /100 | #62 | Exceptional 43.4% |
| Immigrants | Europe | 99.8 /100 | #63 | Exceptional 43.4% |
| Argentineans | 99.7 /100 | #64 | Exceptional 43.3% |
| Zimbabweans | 99.7 /100 | #65 | Exceptional 43.3% |
| Immigrants | Netherlands | 99.7 /100 | #66 | Exceptional 43.3% |