Immigrants from North Macedonia vs Black/African American No Vehicles in Household
COMPARE
Immigrants from North Macedonia
Black/African American
No Vehicles in Household
No Vehicles in Household Comparison
Immigrants from North Macedonia
Blacks/African Americans
10.6%
NO VEHICLES IN HOUSEHOLD
34.6/ 100
METRIC RATING
190th/ 347
METRIC RANK
11.9%
NO VEHICLES IN HOUSEHOLD
1.6/ 100
METRIC RATING
251st/ 347
METRIC RANK
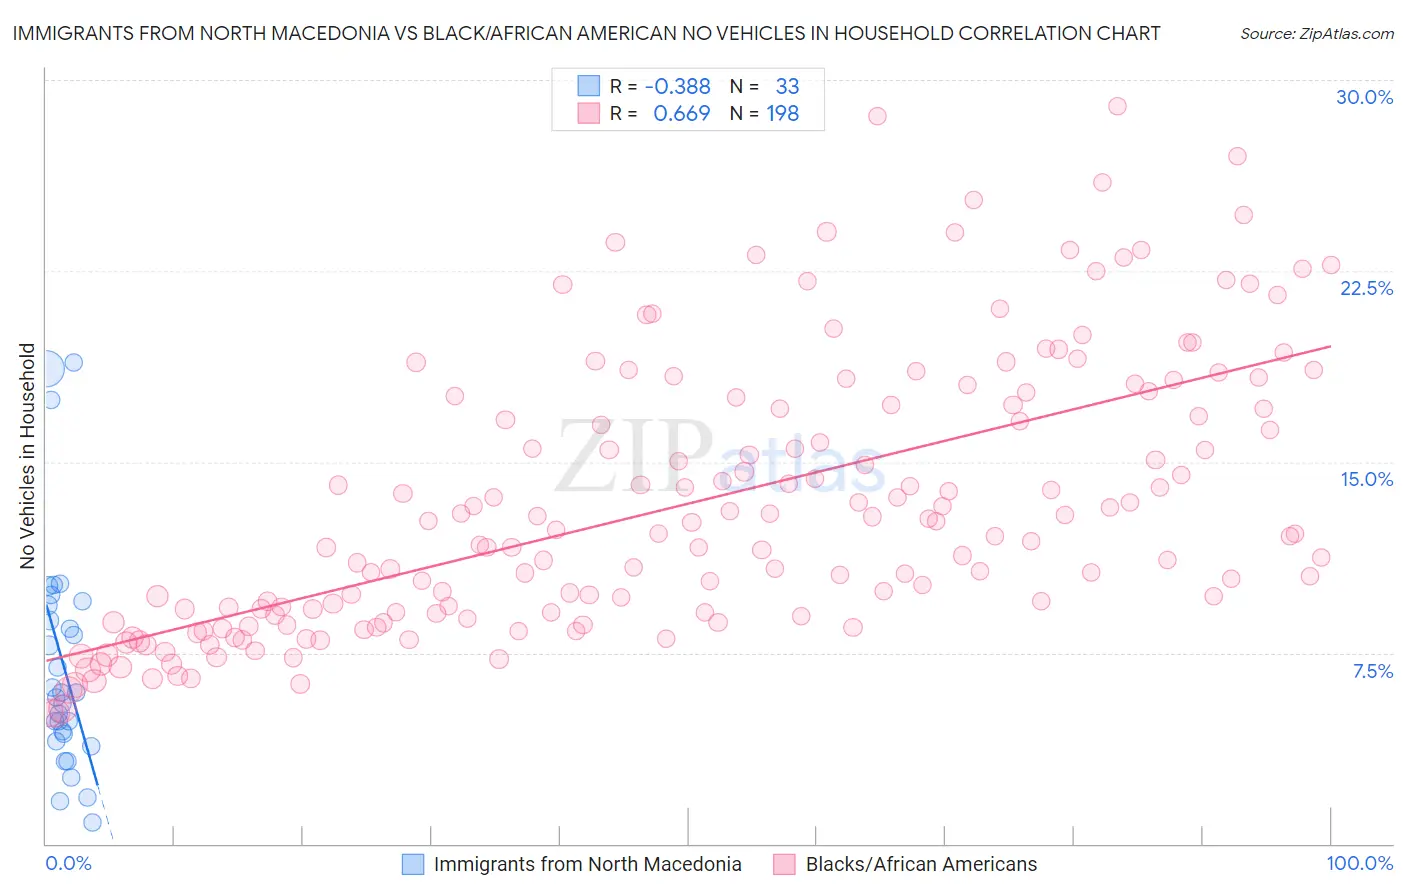
Immigrants from North Macedonia vs Black/African American No Vehicles in Household Correlation Chart
The statistical analysis conducted on geographies consisting of 73,975,262 people shows a mild negative correlation between the proportion of Immigrants from North Macedonia and percentage of households with no vehicle available in the United States with a correlation coefficient (R) of -0.388 and weighted average of 10.6%. Similarly, the statistical analysis conducted on geographies consisting of 549,724,013 people shows a significant positive correlation between the proportion of Blacks/African Americans and percentage of households with no vehicle available in the United States with a correlation coefficient (R) of 0.669 and weighted average of 11.9%, a difference of 11.6%.
No Vehicles in Household Correlation Summary
| Measurement | Immigrants from North Macedonia | Black/African American |
| Minimum | 0.82% | 5.1% |
| Maximum | 18.9% | 29.0% |
| Range | 18.1% | 23.8% |
| Mean | 7.1% | 13.4% |
| Median | 5.9% | 12.2% |
| Interquartile 25% (IQ1) | 4.2% | 9.1% |
| Interquartile 75% (IQ3) | 9.5% | 17.3% |
| Interquartile Range (IQR) | 5.3% | 8.2% |
| Standard Deviation (Sample) | 4.5% | 5.4% |
| Standard Deviation (Population) | 4.4% | 5.3% |
Similar Demographics by No Vehicles in Household
Demographics Similar to Immigrants from North Macedonia by No Vehicles in Household
In terms of no vehicles in household, the demographic groups most similar to Immigrants from North Macedonia are Immigrants from Eritrea (10.6%, a difference of 0.23%), Immigrants from Northern Europe (10.7%, a difference of 0.23%), Carpatho Rusyn (10.7%, a difference of 0.38%), Immigrants from Armenia (10.6%, a difference of 0.42%), and Immigrants from Poland (10.6%, a difference of 0.54%).
| Demographics | Rating | Rank | No Vehicles in Household |
| Natives/Alaskans | 43.7 /100 | #183 | Average 10.5% |
| Immigrants | Nepal | 42.4 /100 | #184 | Average 10.5% |
| South Americans | 41.9 /100 | #185 | Average 10.5% |
| German Russians | 40.6 /100 | #186 | Average 10.5% |
| Immigrants | Poland | 38.4 /100 | #187 | Fair 10.6% |
| Immigrants | Armenia | 37.5 /100 | #188 | Fair 10.6% |
| Immigrants | Eritrea | 36.3 /100 | #189 | Fair 10.6% |
| Immigrants | North Macedonia | 34.6 /100 | #190 | Fair 10.6% |
| Immigrants | Northern Europe | 33.1 /100 | #191 | Fair 10.7% |
| Carpatho Rusyns | 32.1 /100 | #192 | Fair 10.7% |
| Ukrainians | 28.0 /100 | #193 | Fair 10.7% |
| Pueblo | 27.0 /100 | #194 | Fair 10.8% |
| Immigrants | Brazil | 26.3 /100 | #195 | Fair 10.8% |
| Central Americans | 24.3 /100 | #196 | Fair 10.8% |
| Shoshone | 24.1 /100 | #197 | Fair 10.8% |
Demographics Similar to Blacks/African Americans by No Vehicles in Household
In terms of no vehicles in household, the demographic groups most similar to Blacks/African Americans are Immigrants from Serbia (11.9%, a difference of 0.25%), Egyptian (11.9%, a difference of 0.32%), Paiute (11.8%, a difference of 0.35%), Immigrants from Nigeria (11.8%, a difference of 0.57%), and Immigrants from Belgium (11.8%, a difference of 0.60%).
| Demographics | Rating | Rank | No Vehicles in Household |
| Immigrants | Portugal | 2.2 /100 | #244 | Tragic 11.7% |
| Immigrants | Honduras | 2.1 /100 | #245 | Tragic 11.8% |
| Menominee | 2.0 /100 | #246 | Tragic 11.8% |
| Immigrants | Czechoslovakia | 2.0 /100 | #247 | Tragic 11.8% |
| Immigrants | Belgium | 1.9 /100 | #248 | Tragic 11.8% |
| Immigrants | Nigeria | 1.9 /100 | #249 | Tragic 11.8% |
| Paiute | 1.8 /100 | #250 | Tragic 11.8% |
| Blacks/African Americans | 1.6 /100 | #251 | Tragic 11.9% |
| Immigrants | Serbia | 1.5 /100 | #252 | Tragic 11.9% |
| Egyptians | 1.4 /100 | #253 | Tragic 11.9% |
| Immigrants | Uruguay | 1.3 /100 | #254 | Tragic 11.9% |
| Hondurans | 1.2 /100 | #255 | Tragic 12.0% |
| Liberians | 1.2 /100 | #256 | Tragic 12.0% |
| Nigerians | 0.9 /100 | #257 | Tragic 12.1% |
| South American Indians | 0.9 /100 | #258 | Tragic 12.1% |