Immigrants from North Macedonia vs Hmong No Vehicles in Household
COMPARE
Immigrants from North Macedonia
Hmong
No Vehicles in Household
No Vehicles in Household Comparison
Immigrants from North Macedonia
Hmong
10.6%
NO VEHICLES IN HOUSEHOLD
34.6/ 100
METRIC RATING
190th/ 347
METRIC RANK
10.4%
NO VEHICLES IN HOUSEHOLD
52.7/ 100
METRIC RATING
171st/ 347
METRIC RANK
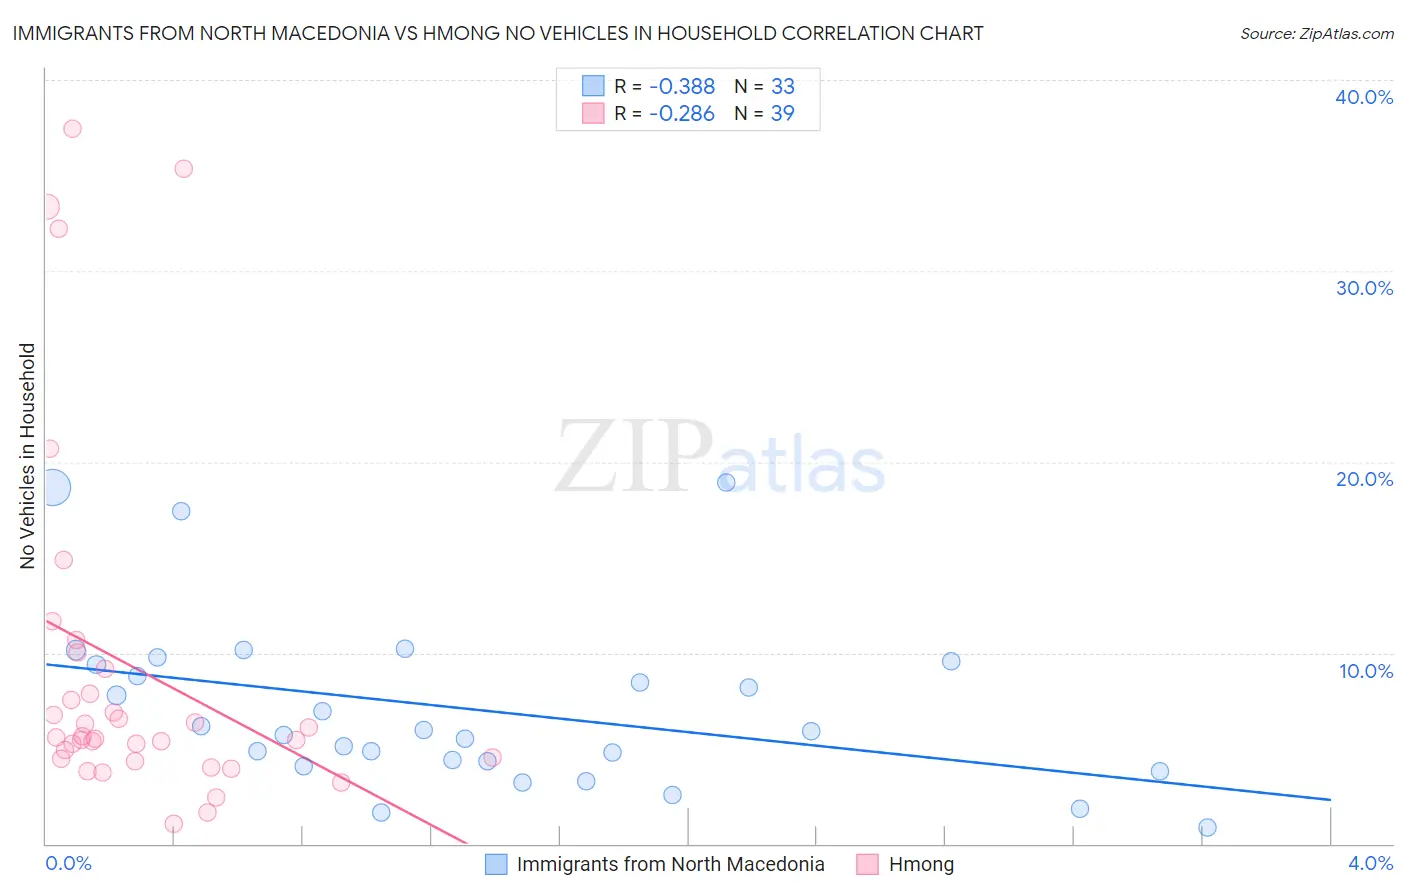
Immigrants from North Macedonia vs Hmong No Vehicles in Household Correlation Chart
The statistical analysis conducted on geographies consisting of 73,975,262 people shows a mild negative correlation between the proportion of Immigrants from North Macedonia and percentage of households with no vehicle available in the United States with a correlation coefficient (R) of -0.388 and weighted average of 10.6%. Similarly, the statistical analysis conducted on geographies consisting of 24,678,157 people shows a weak negative correlation between the proportion of Hmong and percentage of households with no vehicle available in the United States with a correlation coefficient (R) of -0.286 and weighted average of 10.4%, a difference of 2.5%.
No Vehicles in Household Correlation Summary
| Measurement | Immigrants from North Macedonia | Hmong |
| Minimum | 0.82% | 1.0% |
| Maximum | 18.9% | 37.4% |
| Range | 18.1% | 36.4% |
| Mean | 7.1% | 9.2% |
| Median | 5.9% | 5.5% |
| Interquartile 25% (IQ1) | 4.2% | 4.5% |
| Interquartile 75% (IQ3) | 9.5% | 9.2% |
| Interquartile Range (IQR) | 5.3% | 4.7% |
| Standard Deviation (Sample) | 4.5% | 9.4% |
| Standard Deviation (Population) | 4.4% | 9.3% |
Demographics Similar to Immigrants from North Macedonia and Hmong by No Vehicles in Household
In terms of no vehicles in household, the demographic groups most similar to Immigrants from North Macedonia are Immigrants from Eritrea (10.6%, a difference of 0.23%), Immigrants from Armenia (10.6%, a difference of 0.42%), Immigrants from Poland (10.6%, a difference of 0.54%), German Russian (10.5%, a difference of 0.85%), and South American (10.5%, a difference of 1.0%). Similarly, the demographic groups most similar to Hmong are Immigrants from Latin America (10.4%, a difference of 0.060%), Brazilian (10.4%, a difference of 0.14%), Filipino (10.4%, a difference of 0.36%), Immigrants from Sudan (10.4%, a difference of 0.37%), and Immigrants from Burma/Myanmar (10.4%, a difference of 0.49%).
| Demographics | Rating | Rank | No Vehicles in Household |
| Immigrants | Latin America | 53.2 /100 | #170 | Average 10.4% |
| Hmong | 52.7 /100 | #171 | Average 10.4% |
| Brazilians | 51.7 /100 | #172 | Average 10.4% |
| Filipinos | 50.1 /100 | #173 | Average 10.4% |
| Immigrants | Sudan | 50.0 /100 | #174 | Average 10.4% |
| Immigrants | Burma/Myanmar | 49.1 /100 | #175 | Average 10.4% |
| French American Indians | 49.1 /100 | #176 | Average 10.4% |
| Immigrants | El Salvador | 49.1 /100 | #177 | Average 10.4% |
| Immigrants | Ethiopia | 48.0 /100 | #178 | Average 10.4% |
| Ethiopians | 45.8 /100 | #179 | Average 10.5% |
| Arabs | 45.3 /100 | #180 | Average 10.5% |
| Immigrants | Colombia | 44.1 /100 | #181 | Average 10.5% |
| Immigrants | Bulgaria | 43.8 /100 | #182 | Average 10.5% |
| Natives/Alaskans | 43.7 /100 | #183 | Average 10.5% |
| Immigrants | Nepal | 42.4 /100 | #184 | Average 10.5% |
| South Americans | 41.9 /100 | #185 | Average 10.5% |
| German Russians | 40.6 /100 | #186 | Average 10.5% |
| Immigrants | Poland | 38.4 /100 | #187 | Fair 10.6% |
| Immigrants | Armenia | 37.5 /100 | #188 | Fair 10.6% |
| Immigrants | Eritrea | 36.3 /100 | #189 | Fair 10.6% |
| Immigrants | North Macedonia | 34.6 /100 | #190 | Fair 10.6% |