Immigrants from North Macedonia vs Immigrants from Colombia No Vehicles in Household
COMPARE
Immigrants from North Macedonia
Immigrants from Colombia
No Vehicles in Household
No Vehicles in Household Comparison
Immigrants from North Macedonia
Immigrants from Colombia
10.6%
NO VEHICLES IN HOUSEHOLD
34.6/ 100
METRIC RATING
190th/ 347
METRIC RANK
10.5%
NO VEHICLES IN HOUSEHOLD
44.1/ 100
METRIC RATING
181st/ 347
METRIC RANK
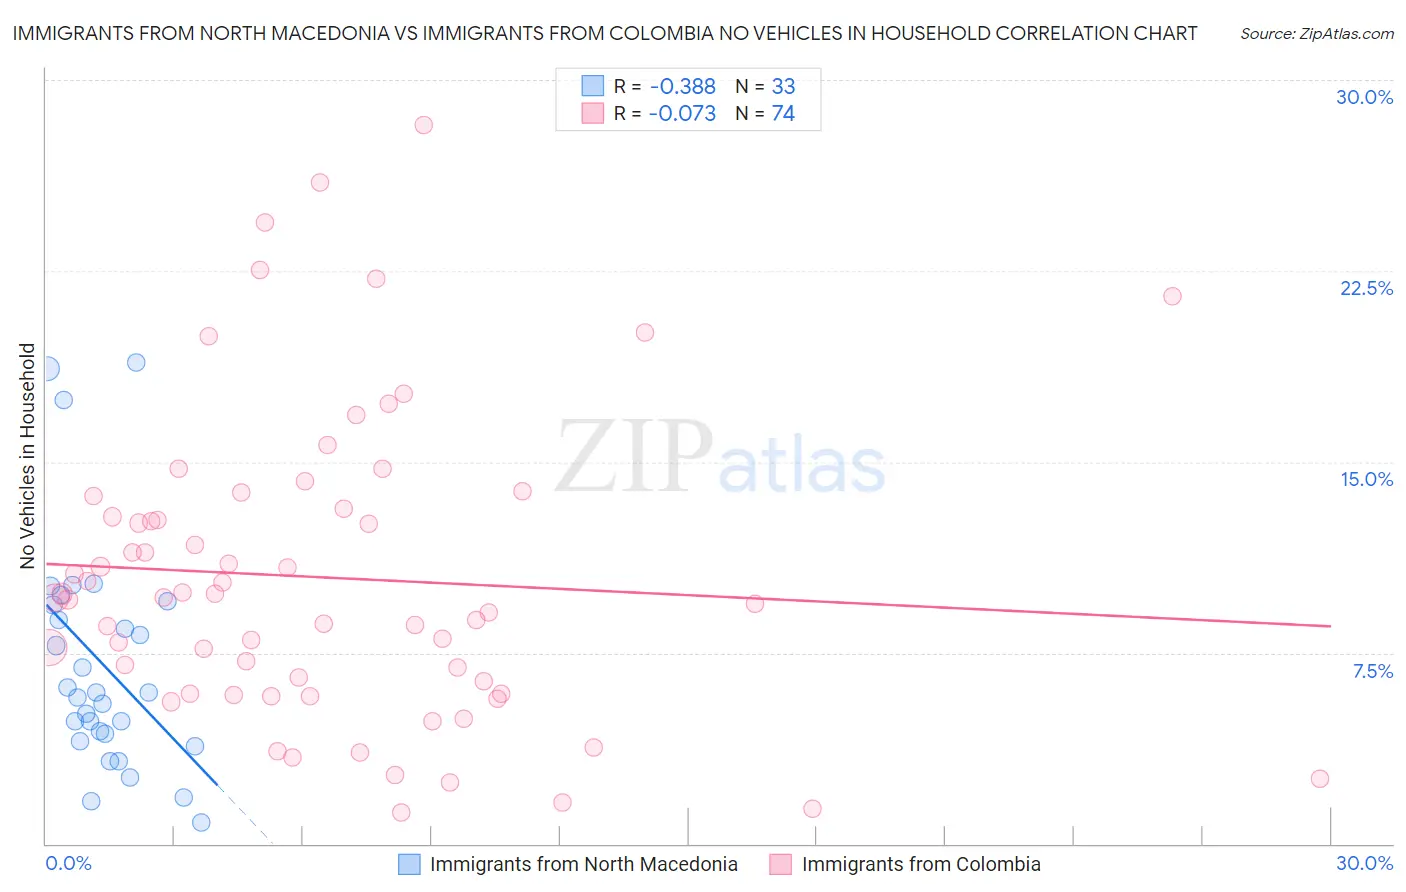
Immigrants from North Macedonia vs Immigrants from Colombia No Vehicles in Household Correlation Chart
The statistical analysis conducted on geographies consisting of 73,975,262 people shows a mild negative correlation between the proportion of Immigrants from North Macedonia and percentage of households with no vehicle available in the United States with a correlation coefficient (R) of -0.388 and weighted average of 10.6%. Similarly, the statistical analysis conducted on geographies consisting of 362,333,216 people shows a slight negative correlation between the proportion of Immigrants from Colombia and percentage of households with no vehicle available in the United States with a correlation coefficient (R) of -0.073 and weighted average of 10.5%, a difference of 1.3%.
No Vehicles in Household Correlation Summary
| Measurement | Immigrants from North Macedonia | Immigrants from Colombia |
| Minimum | 0.82% | 1.2% |
| Maximum | 18.9% | 28.2% |
| Range | 18.1% | 27.0% |
| Mean | 7.1% | 10.5% |
| Median | 5.9% | 9.7% |
| Interquartile 25% (IQ1) | 4.2% | 5.9% |
| Interquartile 75% (IQ3) | 9.5% | 13.1% |
| Interquartile Range (IQR) | 5.3% | 7.2% |
| Standard Deviation (Sample) | 4.5% | 5.9% |
| Standard Deviation (Population) | 4.4% | 5.9% |
Demographics Similar to Immigrants from North Macedonia and Immigrants from Colombia by No Vehicles in Household
In terms of no vehicles in household, the demographic groups most similar to Immigrants from North Macedonia are Immigrants from Eritrea (10.6%, a difference of 0.23%), Immigrants from Northern Europe (10.7%, a difference of 0.23%), Carpatho Rusyn (10.7%, a difference of 0.38%), Immigrants from Armenia (10.6%, a difference of 0.42%), and Immigrants from Poland (10.6%, a difference of 0.54%). Similarly, the demographic groups most similar to Immigrants from Colombia are Immigrants from Bulgaria (10.5%, a difference of 0.040%), Native/Alaskan (10.5%, a difference of 0.060%), Arab (10.5%, a difference of 0.16%), Ethiopian (10.5%, a difference of 0.22%), and Immigrants from Nepal (10.5%, a difference of 0.23%).
| Demographics | Rating | Rank | No Vehicles in Household |
| Immigrants | Burma/Myanmar | 49.1 /100 | #175 | Average 10.4% |
| French American Indians | 49.1 /100 | #176 | Average 10.4% |
| Immigrants | El Salvador | 49.1 /100 | #177 | Average 10.4% |
| Immigrants | Ethiopia | 48.0 /100 | #178 | Average 10.4% |
| Ethiopians | 45.8 /100 | #179 | Average 10.5% |
| Arabs | 45.3 /100 | #180 | Average 10.5% |
| Immigrants | Colombia | 44.1 /100 | #181 | Average 10.5% |
| Immigrants | Bulgaria | 43.8 /100 | #182 | Average 10.5% |
| Natives/Alaskans | 43.7 /100 | #183 | Average 10.5% |
| Immigrants | Nepal | 42.4 /100 | #184 | Average 10.5% |
| South Americans | 41.9 /100 | #185 | Average 10.5% |
| German Russians | 40.6 /100 | #186 | Average 10.5% |
| Immigrants | Poland | 38.4 /100 | #187 | Fair 10.6% |
| Immigrants | Armenia | 37.5 /100 | #188 | Fair 10.6% |
| Immigrants | Eritrea | 36.3 /100 | #189 | Fair 10.6% |
| Immigrants | North Macedonia | 34.6 /100 | #190 | Fair 10.6% |
| Immigrants | Northern Europe | 33.1 /100 | #191 | Fair 10.7% |
| Carpatho Rusyns | 32.1 /100 | #192 | Fair 10.7% |
| Ukrainians | 28.0 /100 | #193 | Fair 10.7% |
| Pueblo | 27.0 /100 | #194 | Fair 10.8% |
| Immigrants | Brazil | 26.3 /100 | #195 | Fair 10.8% |