Immigrants from North Macedonia vs Hmong No Schooling Completed
COMPARE
Immigrants from North Macedonia
Hmong
No Schooling Completed
No Schooling Completed Comparison
Immigrants from North Macedonia
Hmong
2.0%
NO SCHOOLING COMPLETED
75.9/ 100
METRIC RATING
149th/ 347
METRIC RANK
1.9%
NO SCHOOLING COMPLETED
88.5/ 100
METRIC RATING
135th/ 347
METRIC RANK
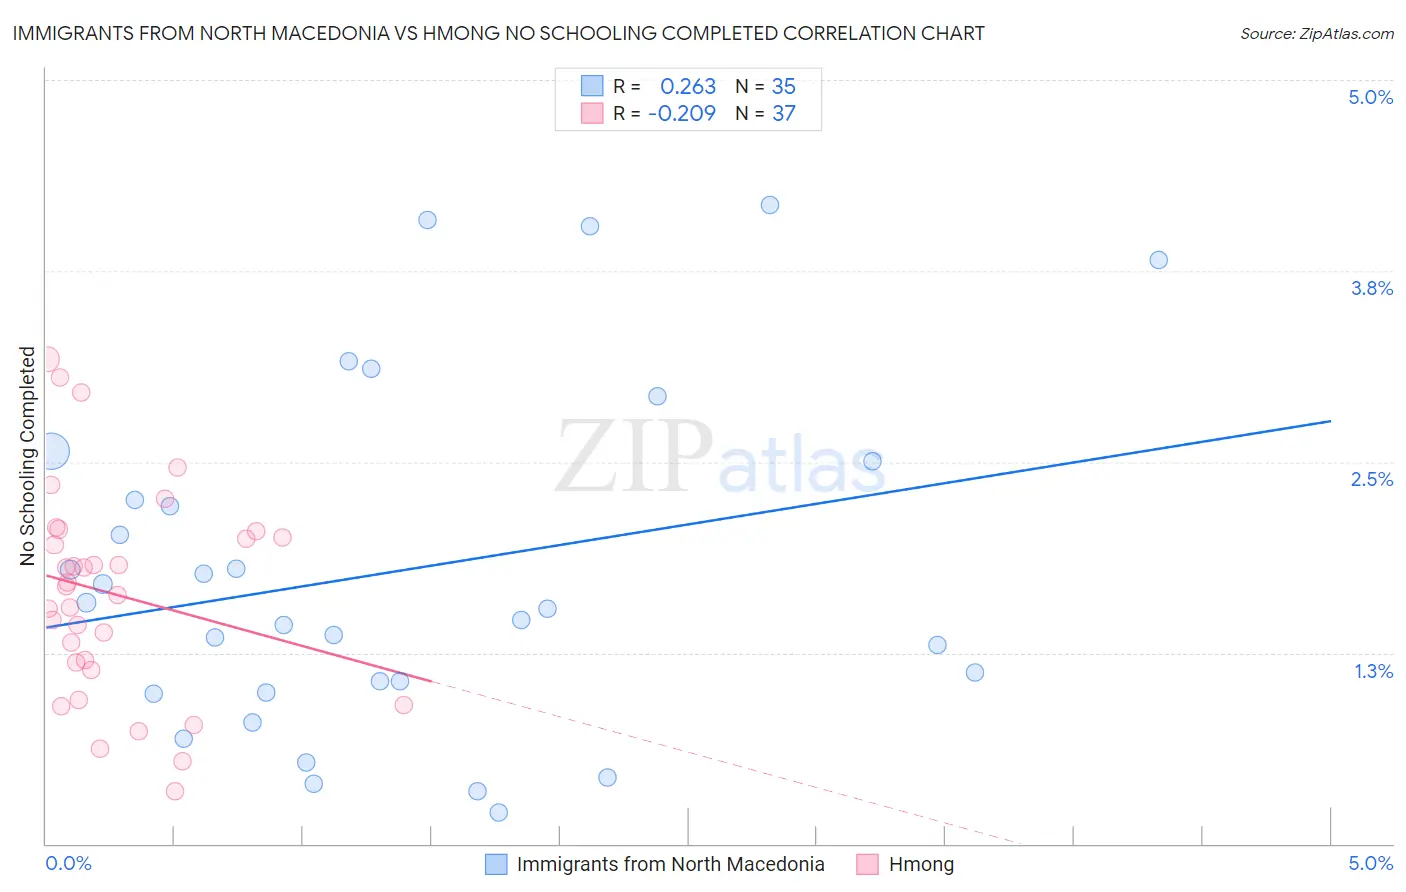
Immigrants from North Macedonia vs Hmong No Schooling Completed Correlation Chart
The statistical analysis conducted on geographies consisting of 74,003,033 people shows a weak positive correlation between the proportion of Immigrants from North Macedonia and percentage of population with no schooling in the United States with a correlation coefficient (R) of 0.263 and weighted average of 2.0%. Similarly, the statistical analysis conducted on geographies consisting of 24,657,468 people shows a weak negative correlation between the proportion of Hmong and percentage of population with no schooling in the United States with a correlation coefficient (R) of -0.209 and weighted average of 1.9%, a difference of 3.2%.
No Schooling Completed Correlation Summary
| Measurement | Immigrants from North Macedonia | Hmong |
| Minimum | 0.20% | 0.34% |
| Maximum | 4.2% | 3.2% |
| Range | 4.0% | 2.8% |
| Mean | 1.8% | 1.6% |
| Median | 1.5% | 1.7% |
| Interquartile 25% (IQ1) | 0.99% | 1.2% |
| Interquartile 75% (IQ3) | 2.5% | 2.0% |
| Interquartile Range (IQR) | 1.5% | 0.86% |
| Standard Deviation (Sample) | 1.1% | 0.68% |
| Standard Deviation (Population) | 1.1% | 0.67% |
Demographics Similar to Immigrants from North Macedonia and Hmong by No Schooling Completed
In terms of no schooling completed, the demographic groups most similar to Immigrants from North Macedonia are Shoshone (2.0%, a difference of 0.15%), Soviet Union (2.0%, a difference of 0.24%), Immigrants from Moldova (2.0%, a difference of 0.41%), Blackfeet (2.0%, a difference of 0.56%), and Alsatian (2.0%, a difference of 0.63%). Similarly, the demographic groups most similar to Hmong are Burmese (1.9%, a difference of 0.090%), Menominee (1.9%, a difference of 0.40%), Immigrants from Turkey (1.9%, a difference of 0.65%), Colville (1.9%, a difference of 0.75%), and Filipino (2.0%, a difference of 0.95%).
| Demographics | Rating | Rank | No Schooling Completed |
| Colville | 90.4 /100 | #132 | Exceptional 1.9% |
| Immigrants | Turkey | 90.2 /100 | #133 | Exceptional 1.9% |
| Menominee | 89.6 /100 | #134 | Excellent 1.9% |
| Hmong | 88.5 /100 | #135 | Excellent 1.9% |
| Burmese | 88.2 /100 | #136 | Excellent 1.9% |
| Filipinos | 85.5 /100 | #137 | Excellent 2.0% |
| Immigrants | Israel | 85.4 /100 | #138 | Excellent 2.0% |
| Jordanians | 84.5 /100 | #139 | Excellent 2.0% |
| Marshallese | 83.5 /100 | #140 | Excellent 2.0% |
| Immigrants | Greece | 83.5 /100 | #141 | Excellent 2.0% |
| Venezuelans | 81.5 /100 | #142 | Excellent 2.0% |
| Immigrants | South Central Asia | 80.0 /100 | #143 | Good 2.0% |
| Alsatians | 79.1 /100 | #144 | Good 2.0% |
| Immigrants | Iran | 79.0 /100 | #145 | Good 2.0% |
| Immigrants | Moldova | 78.0 /100 | #146 | Good 2.0% |
| Soviet Union | 77.1 /100 | #147 | Good 2.0% |
| Shoshone | 76.7 /100 | #148 | Good 2.0% |
| Immigrants | North Macedonia | 75.9 /100 | #149 | Good 2.0% |
| Blackfeet | 72.9 /100 | #150 | Good 2.0% |
| Immigrants | Jordan | 70.9 /100 | #151 | Good 2.0% |
| Immigrants | Eastern Europe | 70.4 /100 | #152 | Good 2.0% |