Bahamian vs Hmong No Vehicles in Household
COMPARE
Bahamian
Hmong
No Vehicles in Household
No Vehicles in Household Comparison
Bahamians
Hmong
9.9%
NO VEHICLES IN HOUSEHOLD
81.0/ 100
METRIC RATING
145th/ 347
METRIC RANK
10.4%
NO VEHICLES IN HOUSEHOLD
52.7/ 100
METRIC RATING
171st/ 347
METRIC RANK
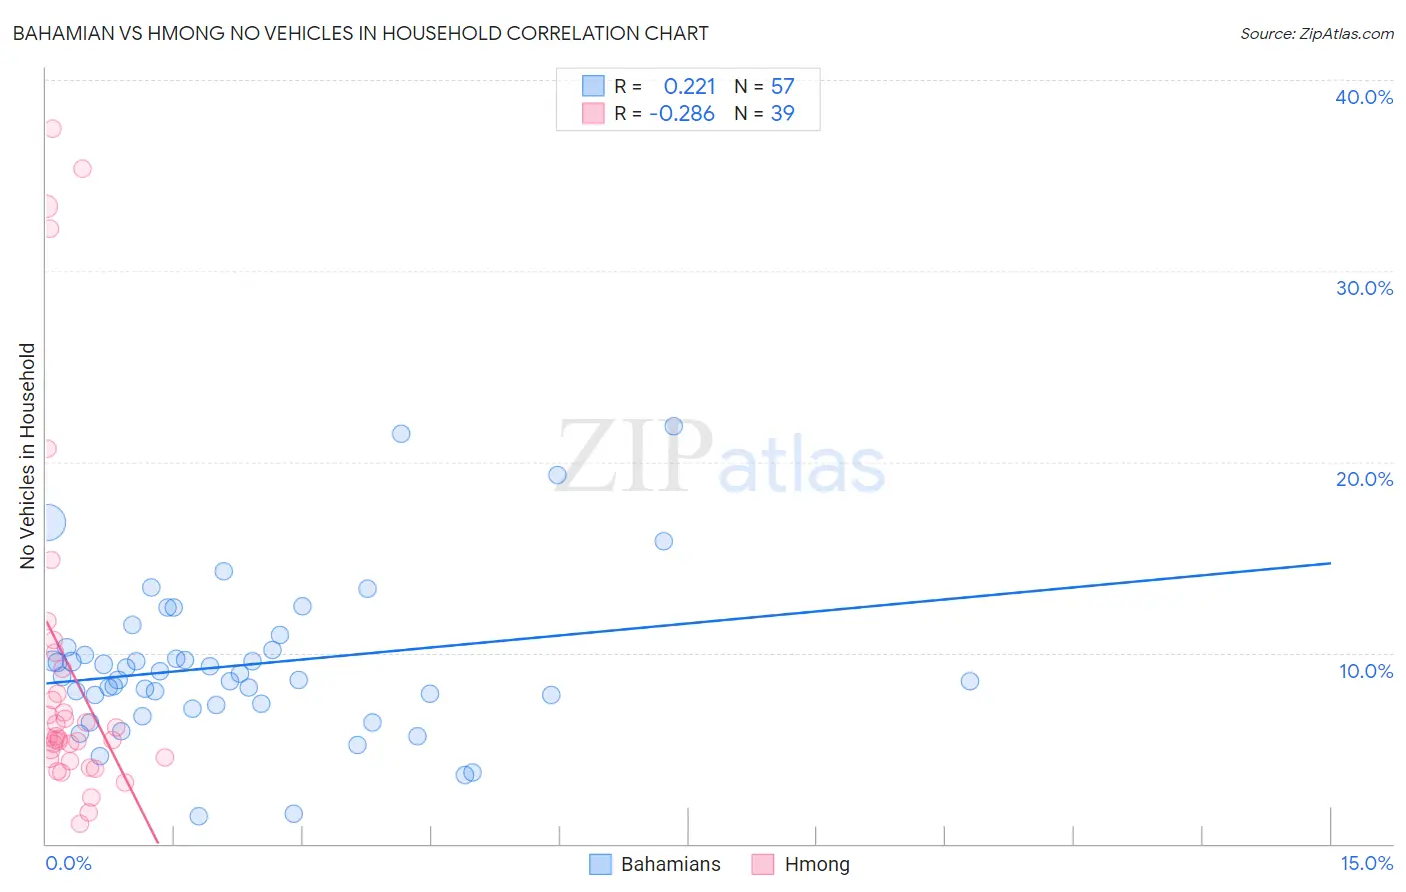
Bahamian vs Hmong No Vehicles in Household Correlation Chart
The statistical analysis conducted on geographies consisting of 112,549,845 people shows a weak positive correlation between the proportion of Bahamians and percentage of households with no vehicle available in the United States with a correlation coefficient (R) of 0.221 and weighted average of 9.9%. Similarly, the statistical analysis conducted on geographies consisting of 24,678,157 people shows a weak negative correlation between the proportion of Hmong and percentage of households with no vehicle available in the United States with a correlation coefficient (R) of -0.286 and weighted average of 10.4%, a difference of 4.8%.
No Vehicles in Household Correlation Summary
| Measurement | Bahamian | Hmong |
| Minimum | 1.4% | 1.0% |
| Maximum | 21.9% | 37.4% |
| Range | 20.5% | 36.4% |
| Mean | 9.3% | 9.2% |
| Median | 8.7% | 5.5% |
| Interquartile 25% (IQ1) | 7.3% | 4.5% |
| Interquartile 75% (IQ3) | 10.2% | 9.2% |
| Interquartile Range (IQR) | 2.9% | 4.7% |
| Standard Deviation (Sample) | 4.1% | 9.4% |
| Standard Deviation (Population) | 4.0% | 9.3% |
Similar Demographics by No Vehicles in Household
Demographics Similar to Bahamians by No Vehicles in Household
In terms of no vehicles in household, the demographic groups most similar to Bahamians are Chilean (9.9%, a difference of 0.030%), Immigrants from Bahamas (9.9%, a difference of 0.030%), Hungarian (9.9%, a difference of 0.23%), Immigrants from Nicaragua (9.9%, a difference of 0.28%), and Immigrants from Zimbabwe (9.9%, a difference of 0.38%).
| Demographics | Rating | Rank | No Vehicles in Household |
| Estonians | 84.2 /100 | #138 | Excellent 9.8% |
| Marshallese | 84.0 /100 | #139 | Excellent 9.8% |
| Immigrants | Lithuania | 84.0 /100 | #140 | Excellent 9.8% |
| Sudanese | 83.1 /100 | #141 | Excellent 9.8% |
| Immigrants | Zimbabwe | 82.6 /100 | #142 | Excellent 9.9% |
| Chileans | 81.2 /100 | #143 | Excellent 9.9% |
| Immigrants | Bahamas | 81.2 /100 | #144 | Excellent 9.9% |
| Bahamians | 81.0 /100 | #145 | Excellent 9.9% |
| Hungarians | 80.0 /100 | #146 | Excellent 9.9% |
| Immigrants | Nicaragua | 79.8 /100 | #147 | Good 9.9% |
| Immigrants | Bosnia and Herzegovina | 79.1 /100 | #148 | Good 9.9% |
| Immigrants | Uganda | 76.1 /100 | #149 | Good 10.0% |
| Colombians | 73.9 /100 | #150 | Good 10.0% |
| Immigrants | Eastern Africa | 73.8 /100 | #151 | Good 10.0% |
| Immigrants | Congo | 73.0 /100 | #152 | Good 10.1% |
Demographics Similar to Hmong by No Vehicles in Household
In terms of no vehicles in household, the demographic groups most similar to Hmong are Immigrants from Latin America (10.4%, a difference of 0.060%), Brazilian (10.4%, a difference of 0.14%), Lumbee (10.3%, a difference of 0.28%), Filipino (10.4%, a difference of 0.36%), and Immigrants from Sudan (10.4%, a difference of 0.37%).
| Demographics | Rating | Rank | No Vehicles in Household |
| South Africans | 61.1 /100 | #164 | Good 10.2% |
| Comanche | 60.8 /100 | #165 | Good 10.2% |
| Immigrants | Costa Rica | 60.5 /100 | #166 | Good 10.3% |
| Immigrants | Saudi Arabia | 58.8 /100 | #167 | Average 10.3% |
| Indonesians | 56.7 /100 | #168 | Average 10.3% |
| Lumbee | 54.7 /100 | #169 | Average 10.3% |
| Immigrants | Latin America | 53.2 /100 | #170 | Average 10.4% |
| Hmong | 52.7 /100 | #171 | Average 10.4% |
| Brazilians | 51.7 /100 | #172 | Average 10.4% |
| Filipinos | 50.1 /100 | #173 | Average 10.4% |
| Immigrants | Sudan | 50.0 /100 | #174 | Average 10.4% |
| Immigrants | Burma/Myanmar | 49.1 /100 | #175 | Average 10.4% |
| French American Indians | 49.1 /100 | #176 | Average 10.4% |
| Immigrants | El Salvador | 49.1 /100 | #177 | Average 10.4% |
| Immigrants | Ethiopia | 48.0 /100 | #178 | Average 10.4% |