Ecuadorian vs Mongolian 1 or more Vehicles in Household
COMPARE
Ecuadorian
Mongolian
1 or more Vehicles in Household
1 or more Vehicles in Household Comparison
Ecuadorians
Mongolians
77.9%
1 OR MORE VEHICLES IN HOUSEHOLD
0.0/ 100
METRIC RATING
328th/ 347
METRIC RANK
87.0%
1 OR MORE VEHICLES IN HOUSEHOLD
0.0/ 100
METRIC RATING
281st/ 347
METRIC RANK
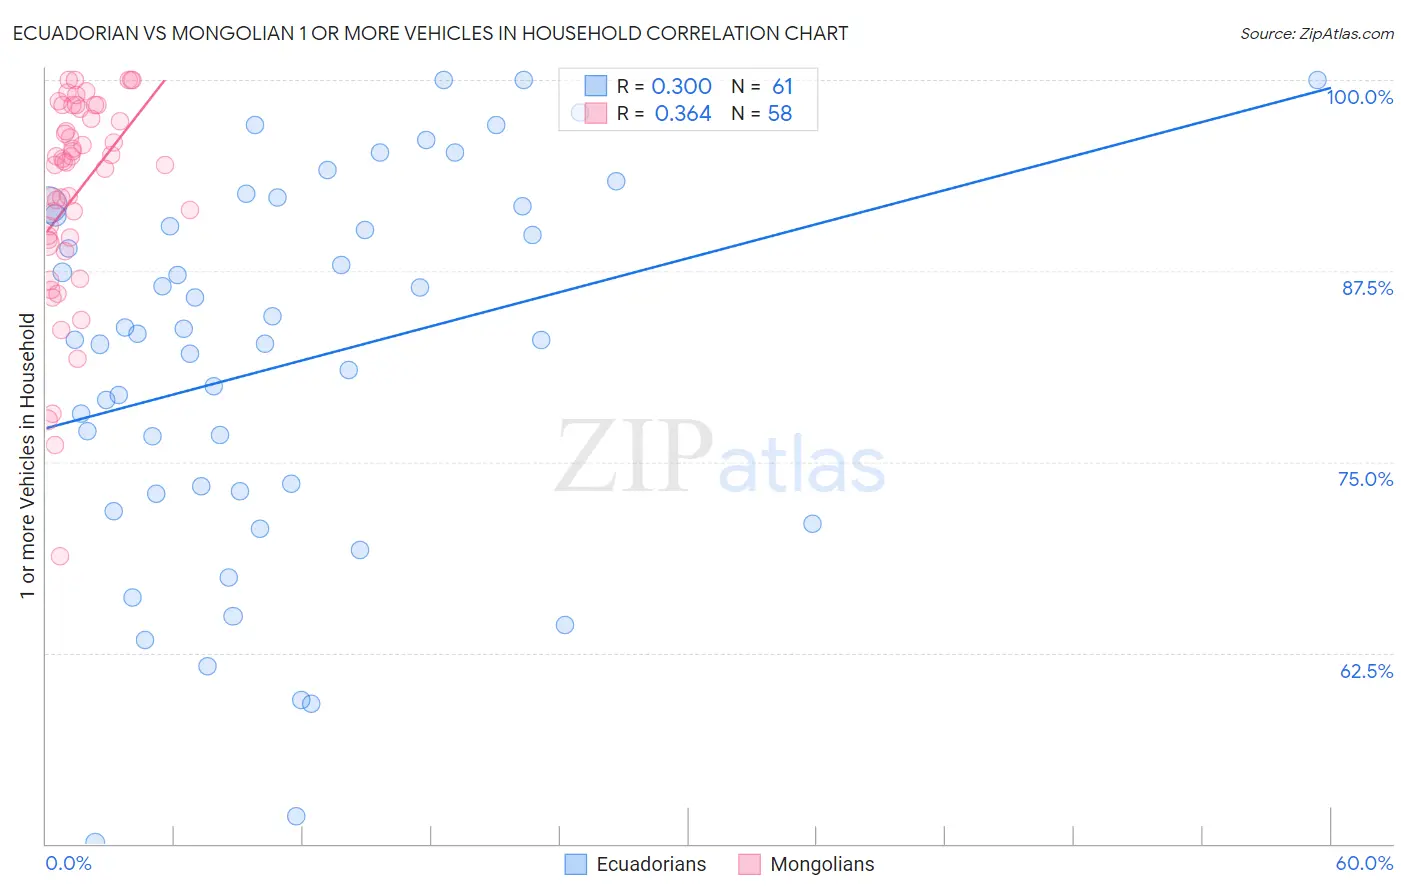
Ecuadorian vs Mongolian 1 or more Vehicles in Household Correlation Chart
The statistical analysis conducted on geographies consisting of 317,563,927 people shows a mild positive correlation between the proportion of Ecuadorians and percentage of households with 1 or more vehicles available in the United States with a correlation coefficient (R) of 0.300 and weighted average of 77.9%. Similarly, the statistical analysis conducted on geographies consisting of 140,176,126 people shows a mild positive correlation between the proportion of Mongolians and percentage of households with 1 or more vehicles available in the United States with a correlation coefficient (R) of 0.364 and weighted average of 87.0%, a difference of 11.6%.
1 or more Vehicles in Household Correlation Summary
| Measurement | Ecuadorian | Mongolian |
| Minimum | 50.1% | 68.8% |
| Maximum | 100.0% | 100.0% |
| Range | 49.9% | 31.2% |
| Mean | 81.4% | 92.6% |
| Median | 83.0% | 94.6% |
| Interquartile 25% (IQ1) | 73.0% | 89.5% |
| Interquartile 75% (IQ3) | 91.4% | 98.1% |
| Interquartile Range (IQR) | 18.4% | 8.6% |
| Standard Deviation (Sample) | 12.3% | 6.7% |
| Standard Deviation (Population) | 12.2% | 6.7% |
Similar Demographics by 1 or more Vehicles in Household
Demographics Similar to Ecuadorians by 1 or more Vehicles in Household
In terms of 1 or more vehicles in household, the demographic groups most similar to Ecuadorians are Immigrants from Dominica (77.8%, a difference of 0.14%), Immigrants from Senegal (79.0%, a difference of 1.3%), Immigrants from Trinidad and Tobago (76.8%, a difference of 1.5%), Immigrants from West Indies (79.5%, a difference of 2.0%), and West Indian (76.4%, a difference of 2.1%).
| Demographics | Rating | Rank | 1 or more Vehicles in Household |
| Jamaicans | 0.0 /100 | #321 | Tragic 82.1% |
| Immigrants | Cabo Verde | 0.0 /100 | #322 | Tragic 81.6% |
| Immigrants | Yemen | 0.0 /100 | #323 | Tragic 80.5% |
| Immigrants | Caribbean | 0.0 /100 | #324 | Tragic 80.4% |
| Senegalese | 0.0 /100 | #325 | Tragic 80.4% |
| Immigrants | West Indies | 0.0 /100 | #326 | Tragic 79.5% |
| Immigrants | Senegal | 0.0 /100 | #327 | Tragic 79.0% |
| Ecuadorians | 0.0 /100 | #328 | Tragic 77.9% |
| Immigrants | Dominica | 0.0 /100 | #329 | Tragic 77.8% |
| Immigrants | Trinidad and Tobago | 0.0 /100 | #330 | Tragic 76.8% |
| West Indians | 0.0 /100 | #331 | Tragic 76.4% |
| Trinidadians and Tobagonians | 0.0 /100 | #332 | Tragic 76.3% |
| Immigrants | Ecuador | 0.0 /100 | #333 | Tragic 76.2% |
| Immigrants | Bangladesh | 0.0 /100 | #334 | Tragic 74.3% |
| Barbadians | 0.0 /100 | #335 | Tragic 74.0% |
Demographics Similar to Mongolians by 1 or more Vehicles in Household
In terms of 1 or more vehicles in household, the demographic groups most similar to Mongolians are Immigrants from Croatia (87.0%, a difference of 0.060%), Immigrants from Albania (87.1%, a difference of 0.090%), Immigrants from Southern Europe (87.1%, a difference of 0.10%), Alsatian (87.1%, a difference of 0.14%), and Immigrants from France (87.1%, a difference of 0.20%).
| Demographics | Rating | Rank | 1 or more Vehicles in Household |
| Immigrants | Morocco | 0.1 /100 | #274 | Tragic 87.4% |
| Immigrants | Singapore | 0.1 /100 | #275 | Tragic 87.2% |
| Immigrants | France | 0.1 /100 | #276 | Tragic 87.1% |
| Alsatians | 0.1 /100 | #277 | Tragic 87.1% |
| Immigrants | Southern Europe | 0.1 /100 | #278 | Tragic 87.1% |
| Immigrants | Albania | 0.1 /100 | #279 | Tragic 87.1% |
| Immigrants | Croatia | 0.0 /100 | #280 | Tragic 87.0% |
| Mongolians | 0.0 /100 | #281 | Tragic 87.0% |
| Colville | 0.0 /100 | #282 | Tragic 86.8% |
| Immigrants | Eastern Europe | 0.0 /100 | #283 | Tragic 86.7% |
| Central American Indians | 0.0 /100 | #284 | Tragic 86.7% |
| Immigrants | Kazakhstan | 0.0 /100 | #285 | Tragic 86.6% |
| Immigrants | Eastern Asia | 0.0 /100 | #286 | Tragic 86.5% |
| Immigrants | Malaysia | 0.0 /100 | #287 | Tragic 86.5% |
| Hopi | 0.0 /100 | #288 | Tragic 86.4% |