Immigrants from Nicaragua vs Immigrants from India Family Households
COMPARE
Immigrants from Nicaragua
Immigrants from India
Family Households
Family Households Comparison
Immigrants from Nicaragua
Immigrants from India
67.5%
FAMILY HOUSEHOLDS
100.0/ 100
METRIC RATING
25th/ 347
METRIC RANK
67.4%
FAMILY HOUSEHOLDS
100.0/ 100
METRIC RATING
26th/ 347
METRIC RANK
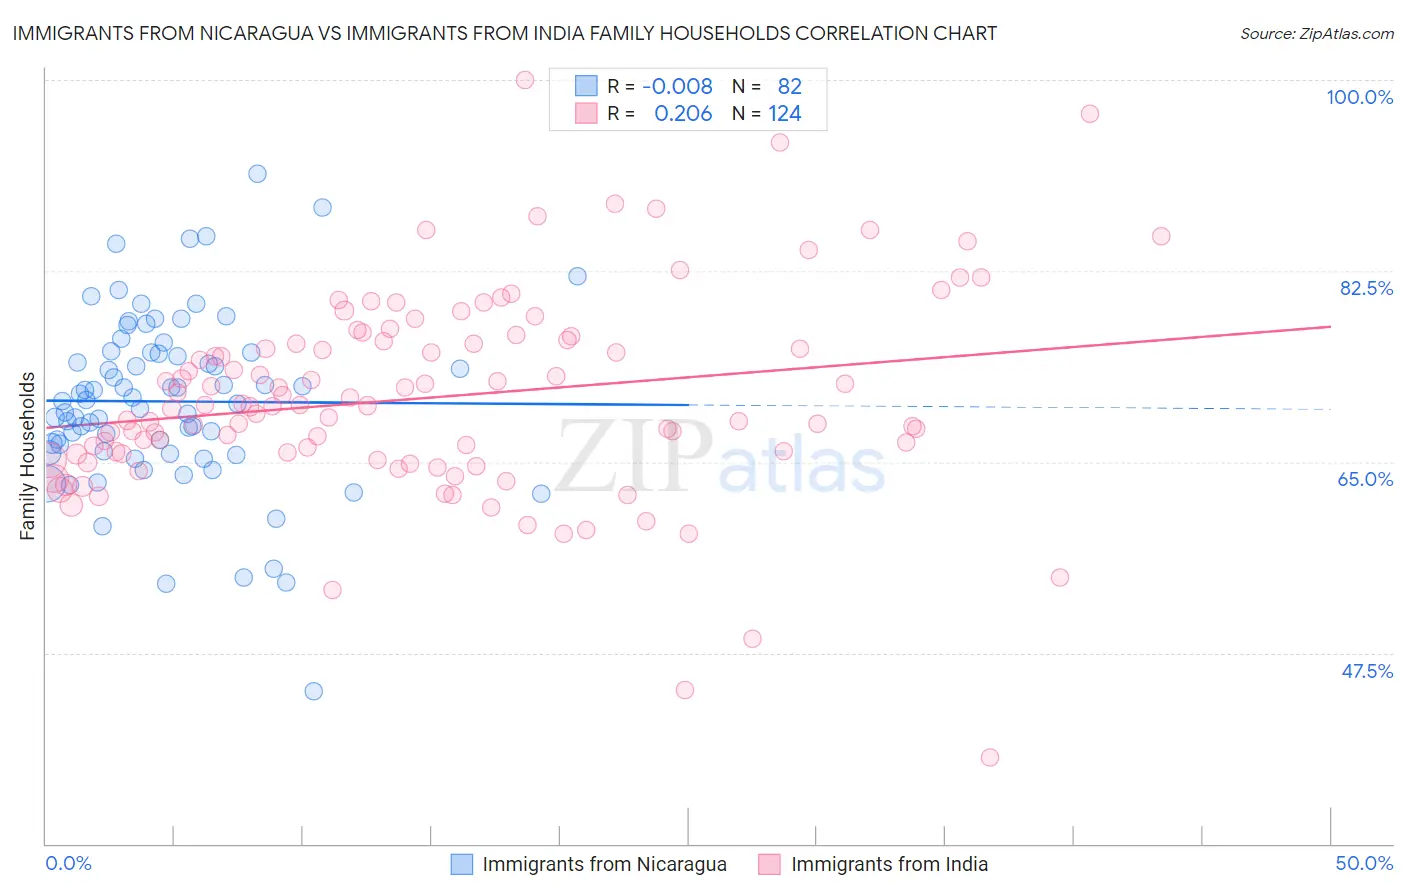
Immigrants from Nicaragua vs Immigrants from India Family Households Correlation Chart
The statistical analysis conducted on geographies consisting of 236,325,985 people shows no correlation between the proportion of Immigrants from Nicaragua and percentage of family households in the United States with a correlation coefficient (R) of -0.008 and weighted average of 67.5%. Similarly, the statistical analysis conducted on geographies consisting of 433,768,337 people shows a weak positive correlation between the proportion of Immigrants from India and percentage of family households in the United States with a correlation coefficient (R) of 0.206 and weighted average of 67.4%, a difference of 0.010%.
Family Households Correlation Summary
| Measurement | Immigrants from Nicaragua | Immigrants from India |
| Minimum | 43.9% | 37.9% |
| Maximum | 91.5% | 100.0% |
| Range | 47.5% | 62.1% |
| Mean | 70.5% | 70.9% |
| Median | 70.7% | 70.2% |
| Interquartile 25% (IQ1) | 66.0% | 65.7% |
| Interquartile 75% (IQ3) | 75.0% | 76.1% |
| Interquartile Range (IQR) | 9.0% | 10.4% |
| Standard Deviation (Sample) | 8.0% | 9.4% |
| Standard Deviation (Population) | 7.9% | 9.4% |
Demographics Similar to Immigrants from Nicaragua and Immigrants from India by Family Households
In terms of family households, the demographic groups most similar to Immigrants from Nicaragua are Immigrants from South Eastern Asia (67.5%, a difference of 0.020%), Hispanic or Latino (67.4%, a difference of 0.050%), Hawaiian (67.4%, a difference of 0.070%), Nicaraguan (67.4%, a difference of 0.14%), and Immigrants from Pakistan (67.7%, a difference of 0.31%). Similarly, the demographic groups most similar to Immigrants from India are Immigrants from South Eastern Asia (67.5%, a difference of 0.040%), Hispanic or Latino (67.4%, a difference of 0.040%), Hawaiian (67.4%, a difference of 0.060%), Nicaraguan (67.4%, a difference of 0.13%), and Immigrants from Peru (67.2%, a difference of 0.30%).
| Demographics | Rating | Rank | Family Households |
| Assyrians/Chaldeans/Syriacs | 100.0 /100 | #15 | Exceptional 68.2% |
| Immigrants | Vietnam | 100.0 /100 | #16 | Exceptional 68.2% |
| Chinese | 100.0 /100 | #17 | Exceptional 68.1% |
| Immigrants | Taiwan | 100.0 /100 | #18 | Exceptional 68.0% |
| Samoans | 100.0 /100 | #19 | Exceptional 67.9% |
| Inupiat | 100.0 /100 | #20 | Exceptional 67.8% |
| Cubans | 100.0 /100 | #21 | Exceptional 67.7% |
| Sri Lankans | 100.0 /100 | #22 | Exceptional 67.7% |
| Immigrants | Pakistan | 100.0 /100 | #23 | Exceptional 67.7% |
| Immigrants | South Eastern Asia | 100.0 /100 | #24 | Exceptional 67.5% |
| Immigrants | Nicaragua | 100.0 /100 | #25 | Exceptional 67.5% |
| Immigrants | India | 100.0 /100 | #26 | Exceptional 67.4% |
| Hispanics or Latinos | 100.0 /100 | #27 | Exceptional 67.4% |
| Hawaiians | 100.0 /100 | #28 | Exceptional 67.4% |
| Nicaraguans | 100.0 /100 | #29 | Exceptional 67.4% |
| Immigrants | Peru | 100.0 /100 | #30 | Exceptional 67.2% |
| Immigrants | Latin America | 100.0 /100 | #31 | Exceptional 67.2% |
| Nepalese | 100.0 /100 | #32 | Exceptional 67.2% |
| Salvadorans | 100.0 /100 | #33 | Exceptional 67.2% |
| Thais | 100.0 /100 | #34 | Exceptional 67.2% |
| Tohono O'odham | 100.0 /100 | #35 | Exceptional 67.1% |