Immigrants from Nepal vs Immigrants from Western Africa 2 or more Vehicles in Household
COMPARE
Immigrants from Nepal
Immigrants from Western Africa
2 or more Vehicles in Household
2 or more Vehicles in Household Comparison
Immigrants from Nepal
Immigrants from Western Africa
53.5%
2 OR MORE VEHICLES IN HOUSEHOLD
3.6/ 100
METRIC RATING
230th/ 347
METRIC RANK
49.4%
2 OR MORE VEHICLES IN HOUSEHOLD
0.0/ 100
METRIC RATING
305th/ 347
METRIC RANK
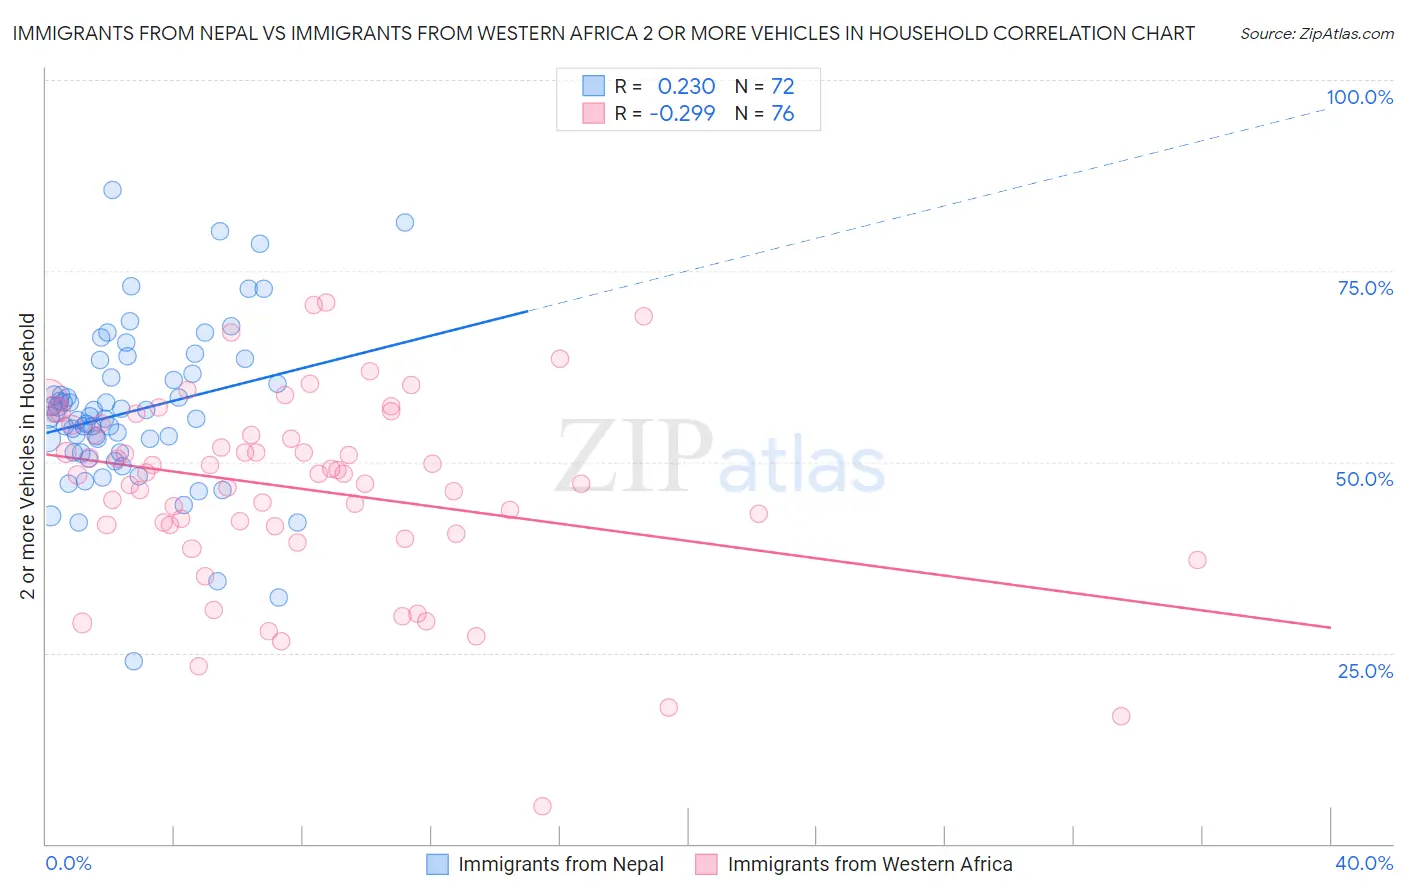
Immigrants from Nepal vs Immigrants from Western Africa 2 or more Vehicles in Household Correlation Chart
The statistical analysis conducted on geographies consisting of 186,595,631 people shows a weak positive correlation between the proportion of Immigrants from Nepal and percentage of households with 2 or more vehicles available in the United States with a correlation coefficient (R) of 0.230 and weighted average of 53.5%. Similarly, the statistical analysis conducted on geographies consisting of 357,581,747 people shows a weak negative correlation between the proportion of Immigrants from Western Africa and percentage of households with 2 or more vehicles available in the United States with a correlation coefficient (R) of -0.299 and weighted average of 49.4%, a difference of 8.5%.
2 or more Vehicles in Household Correlation Summary
| Measurement | Immigrants from Nepal | Immigrants from Western Africa |
| Minimum | 23.8% | 4.9% |
| Maximum | 85.6% | 70.9% |
| Range | 61.8% | 66.0% |
| Mean | 56.7% | 46.5% |
| Median | 55.9% | 48.5% |
| Interquartile 25% (IQ1) | 51.2% | 41.6% |
| Interquartile 75% (IQ3) | 61.3% | 54.2% |
| Interquartile Range (IQR) | 10.1% | 12.6% |
| Standard Deviation (Sample) | 10.6% | 12.5% |
| Standard Deviation (Population) | 10.5% | 12.4% |
Similar Demographics by 2 or more Vehicles in Household
Demographics Similar to Immigrants from Nepal by 2 or more Vehicles in Household
In terms of 2 or more vehicles in household, the demographic groups most similar to Immigrants from Nepal are Panamanian (53.5%, a difference of 0.050%), Immigrants from Turkey (53.6%, a difference of 0.060%), Alaska Native (53.6%, a difference of 0.080%), Immigrants from Guatemala (53.5%, a difference of 0.12%), and Ugandan (53.5%, a difference of 0.13%).
| Demographics | Rating | Rank | 2 or more Vehicles in Household |
| Immigrants | Bosnia and Herzegovina | 5.5 /100 | #223 | Tragic 53.8% |
| Brazilians | 5.3 /100 | #224 | Tragic 53.8% |
| Immigrants | Egypt | 5.2 /100 | #225 | Tragic 53.8% |
| Immigrants | Eastern Africa | 5.1 /100 | #226 | Tragic 53.7% |
| Sudanese | 4.1 /100 | #227 | Tragic 53.6% |
| Alaska Natives | 3.9 /100 | #228 | Tragic 53.6% |
| Immigrants | Turkey | 3.8 /100 | #229 | Tragic 53.6% |
| Immigrants | Nepal | 3.6 /100 | #230 | Tragic 53.5% |
| Panamanians | 3.4 /100 | #231 | Tragic 53.5% |
| Immigrants | Guatemala | 3.2 /100 | #232 | Tragic 53.5% |
| Ugandans | 3.2 /100 | #233 | Tragic 53.5% |
| Immigrants | Switzerland | 3.0 /100 | #234 | Tragic 53.4% |
| Immigrants | Middle Africa | 3.0 /100 | #235 | Tragic 53.4% |
| Indonesians | 2.7 /100 | #236 | Tragic 53.4% |
| Macedonians | 2.4 /100 | #237 | Tragic 53.3% |
Demographics Similar to Immigrants from Western Africa by 2 or more Vehicles in Household
In terms of 2 or more vehicles in household, the demographic groups most similar to Immigrants from Western Africa are Immigrants from Israel (49.2%, a difference of 0.26%), Hopi (49.0%, a difference of 0.69%), Albanian (49.0%, a difference of 0.76%), Immigrants from Belize (49.9%, a difference of 1.1%), and Moroccan (48.8%, a difference of 1.1%).
| Demographics | Rating | Rank | 2 or more Vehicles in Household |
| Paraguayans | 0.0 /100 | #298 | Tragic 50.3% |
| Immigrants | Morocco | 0.0 /100 | #299 | Tragic 50.3% |
| Immigrants | Russia | 0.0 /100 | #300 | Tragic 50.3% |
| Immigrants | Greece | 0.0 /100 | #301 | Tragic 50.2% |
| Immigrants | South America | 0.0 /100 | #302 | Tragic 50.2% |
| Tohono O'odham | 0.0 /100 | #303 | Tragic 50.0% |
| Immigrants | Belize | 0.0 /100 | #304 | Tragic 49.9% |
| Immigrants | Western Africa | 0.0 /100 | #305 | Tragic 49.4% |
| Immigrants | Israel | 0.0 /100 | #306 | Tragic 49.2% |
| Hopi | 0.0 /100 | #307 | Tragic 49.0% |
| Albanians | 0.0 /100 | #308 | Tragic 49.0% |
| Moroccans | 0.0 /100 | #309 | Tragic 48.8% |
| Ghanaians | 0.0 /100 | #310 | Tragic 48.0% |
| Immigrants | Belarus | 0.0 /100 | #311 | Tragic 47.9% |
| Haitians | 0.0 /100 | #312 | Tragic 47.6% |