Immigrants from Moldova vs Bulgarian 1 or more Vehicles in Household
COMPARE
Immigrants from Moldova
Bulgarian
1 or more Vehicles in Household
1 or more Vehicles in Household Comparison
Immigrants from Moldova
Bulgarians
90.2%
1 OR MORE VEHICLES IN HOUSEHOLD
83.1/ 100
METRIC RATING
141st/ 347
METRIC RANK
91.1%
1 OR MORE VEHICLES IN HOUSEHOLD
98.4/ 100
METRIC RATING
101st/ 347
METRIC RANK
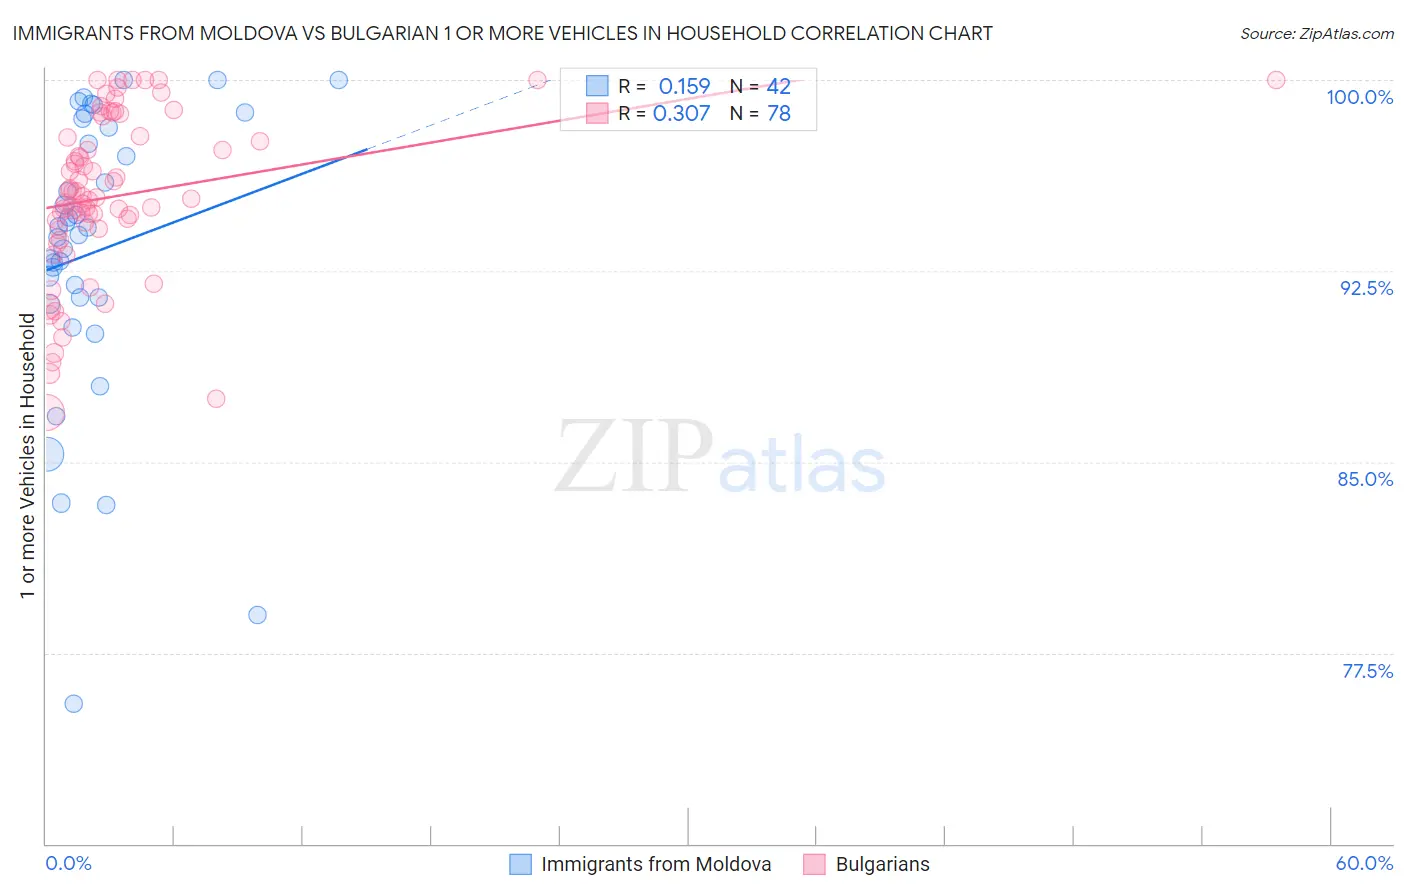
Immigrants from Moldova vs Bulgarian 1 or more Vehicles in Household Correlation Chart
The statistical analysis conducted on geographies consisting of 124,288,991 people shows a poor positive correlation between the proportion of Immigrants from Moldova and percentage of households with 1 or more vehicles available in the United States with a correlation coefficient (R) of 0.159 and weighted average of 90.2%. Similarly, the statistical analysis conducted on geographies consisting of 205,574,204 people shows a mild positive correlation between the proportion of Bulgarians and percentage of households with 1 or more vehicles available in the United States with a correlation coefficient (R) of 0.307 and weighted average of 91.1%, a difference of 0.97%.
1 or more Vehicles in Household Correlation Summary
| Measurement | Immigrants from Moldova | Bulgarian |
| Minimum | 75.5% | 86.9% |
| Maximum | 100.0% | 100.0% |
| Range | 24.5% | 13.1% |
| Mean | 93.2% | 95.5% |
| Median | 94.1% | 95.4% |
| Interquartile 25% (IQ1) | 91.4% | 94.1% |
| Interquartile 75% (IQ3) | 98.1% | 97.8% |
| Interquartile Range (IQR) | 6.7% | 3.7% |
| Standard Deviation (Sample) | 5.7% | 3.2% |
| Standard Deviation (Population) | 5.6% | 3.2% |
Similar Demographics by 1 or more Vehicles in Household
Demographics Similar to Immigrants from Moldova by 1 or more Vehicles in Household
In terms of 1 or more vehicles in household, the demographic groups most similar to Immigrants from Moldova are Immigrants from Lithuania (90.2%, a difference of 0.0%), Immigrants from Bahamas (90.2%, a difference of 0.040%), Immigrants from Zimbabwe (90.2%, a difference of 0.040%), Sioux (90.2%, a difference of 0.050%), and Sudanese (90.3%, a difference of 0.060%).
| Demographics | Rating | Rank | 1 or more Vehicles in Household |
| Kenyans | 87.0 /100 | #134 | Excellent 90.4% |
| Immigrants | Oceania | 86.9 /100 | #135 | Excellent 90.4% |
| Hungarians | 86.5 /100 | #136 | Excellent 90.3% |
| Latvians | 86.3 /100 | #137 | Excellent 90.3% |
| Syrians | 86.3 /100 | #138 | Excellent 90.3% |
| Estonians | 85.6 /100 | #139 | Excellent 90.3% |
| Sudanese | 85.2 /100 | #140 | Excellent 90.3% |
| Immigrants | Moldova | 83.1 /100 | #141 | Excellent 90.2% |
| Immigrants | Lithuania | 83.0 /100 | #142 | Excellent 90.2% |
| Immigrants | Bahamas | 81.5 /100 | #143 | Excellent 90.2% |
| Immigrants | Zimbabwe | 81.5 /100 | #144 | Excellent 90.2% |
| Sioux | 81.3 /100 | #145 | Excellent 90.2% |
| Bahamians | 80.5 /100 | #146 | Excellent 90.2% |
| Chileans | 79.8 /100 | #147 | Good 90.2% |
| Immigrants | Eastern Africa | 78.2 /100 | #148 | Good 90.1% |
Demographics Similar to Bulgarians by 1 or more Vehicles in Household
In terms of 1 or more vehicles in household, the demographic groups most similar to Bulgarians are Immigrants from Central America (91.1%, a difference of 0.010%), Seminole (91.1%, a difference of 0.020%), Yugoslavian (91.1%, a difference of 0.030%), Asian (91.1%, a difference of 0.040%), and Immigrants from Bolivia (91.2%, a difference of 0.050%).
| Demographics | Rating | Rank | 1 or more Vehicles in Household |
| Immigrants | Cuba | 99.1 /100 | #94 | Exceptional 91.3% |
| Austrians | 99.0 /100 | #95 | Exceptional 91.3% |
| Potawatomi | 99.0 /100 | #96 | Exceptional 91.3% |
| Pakistanis | 99.0 /100 | #97 | Exceptional 91.3% |
| Slavs | 98.7 /100 | #98 | Exceptional 91.2% |
| Immigrants | Bolivia | 98.6 /100 | #99 | Exceptional 91.2% |
| Immigrants | Central America | 98.4 /100 | #100 | Exceptional 91.1% |
| Bulgarians | 98.4 /100 | #101 | Exceptional 91.1% |
| Seminole | 98.3 /100 | #102 | Exceptional 91.1% |
| Yugoslavians | 98.3 /100 | #103 | Exceptional 91.1% |
| Asians | 98.2 /100 | #104 | Exceptional 91.1% |
| Laotians | 98.0 /100 | #105 | Exceptional 91.0% |
| Zimbabweans | 97.7 /100 | #106 | Exceptional 91.0% |
| Maltese | 97.7 /100 | #107 | Exceptional 91.0% |
| Hispanics or Latinos | 97.6 /100 | #108 | Exceptional 91.0% |