Immigrants from Mexico vs Immigrants from Colombia In Labor Force | Age 20-64
COMPARE
Immigrants from Mexico
Immigrants from Colombia
In Labor Force | Age 20-64
In Labor Force | Age 20-64 Comparison
Immigrants from Mexico
Immigrants from Colombia
77.3%
IN LABOR FORCE | AGE 20-64
0.0/ 100
METRIC RATING
304th/ 347
METRIC RANK
80.2%
IN LABOR FORCE | AGE 20-64
97.8/ 100
METRIC RATING
77th/ 347
METRIC RANK
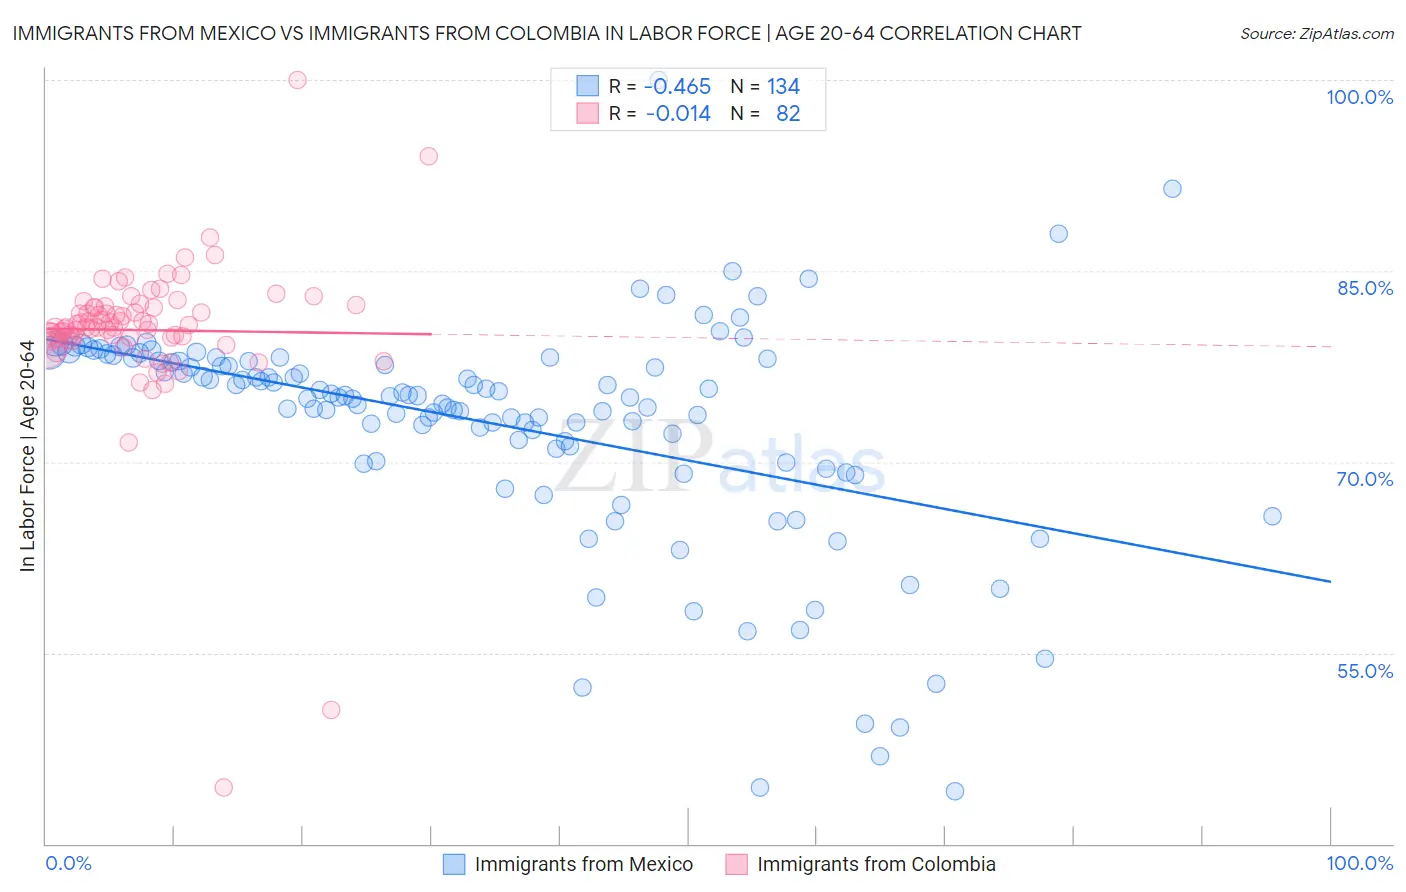
Immigrants from Mexico vs Immigrants from Colombia In Labor Force | Age 20-64 Correlation Chart
The statistical analysis conducted on geographies consisting of 513,715,618 people shows a moderate negative correlation between the proportion of Immigrants from Mexico and labor force participation rate among population between the ages 20 and 64 in the United States with a correlation coefficient (R) of -0.465 and weighted average of 77.3%. Similarly, the statistical analysis conducted on geographies consisting of 378,682,126 people shows no correlation between the proportion of Immigrants from Colombia and labor force participation rate among population between the ages 20 and 64 in the United States with a correlation coefficient (R) of -0.014 and weighted average of 80.2%, a difference of 3.8%.
In Labor Force | Age 20-64 Correlation Summary
| Measurement | Immigrants from Mexico | Immigrants from Colombia |
| Minimum | 44.1% | 44.4% |
| Maximum | 100.0% | 100.0% |
| Range | 55.9% | 55.6% |
| Mean | 73.0% | 80.4% |
| Median | 75.2% | 80.6% |
| Interquartile 25% (IQ1) | 71.0% | 79.7% |
| Interquartile 75% (IQ3) | 78.1% | 82.1% |
| Interquartile Range (IQR) | 7.1% | 2.4% |
| Standard Deviation (Sample) | 8.8% | 6.3% |
| Standard Deviation (Population) | 8.7% | 6.3% |
Similar Demographics by In Labor Force | Age 20-64
Demographics Similar to Immigrants from Mexico by In Labor Force | Age 20-64
In terms of in labor force | age 20-64, the demographic groups most similar to Immigrants from Mexico are Mexican (77.2%, a difference of 0.040%), Potawatomi (77.2%, a difference of 0.060%), Chippewa (77.3%, a difference of 0.070%), Central American Indian (77.1%, a difference of 0.23%), and Alaska Native (77.0%, a difference of 0.28%).
| Demographics | Rating | Rank | In Labor Force | Age 20-64 |
| Dominicans | 0.0 /100 | #297 | Tragic 77.7% |
| Cree | 0.0 /100 | #298 | Tragic 77.7% |
| Hispanics or Latinos | 0.0 /100 | #299 | Tragic 77.6% |
| Spanish American Indians | 0.0 /100 | #300 | Tragic 77.6% |
| Nepalese | 0.0 /100 | #301 | Tragic 77.5% |
| Iroquois | 0.0 /100 | #302 | Tragic 77.5% |
| Chippewa | 0.0 /100 | #303 | Tragic 77.3% |
| Immigrants | Mexico | 0.0 /100 | #304 | Tragic 77.3% |
| Mexicans | 0.0 /100 | #305 | Tragic 77.2% |
| Potawatomi | 0.0 /100 | #306 | Tragic 77.2% |
| Central American Indians | 0.0 /100 | #307 | Tragic 77.1% |
| Alaska Natives | 0.0 /100 | #308 | Tragic 77.0% |
| Americans | 0.0 /100 | #309 | Tragic 77.0% |
| Comanche | 0.0 /100 | #310 | Tragic 77.0% |
| Blackfeet | 0.0 /100 | #311 | Tragic 77.0% |
Demographics Similar to Immigrants from Colombia by In Labor Force | Age 20-64
In terms of in labor force | age 20-64, the demographic groups most similar to Immigrants from Colombia are Egyptian (80.2%, a difference of 0.0%), Immigrants from Romania (80.2%, a difference of 0.0%), Immigrants from Afghanistan (80.2%, a difference of 0.010%), Asian (80.2%, a difference of 0.010%), and Immigrants from Croatia (80.1%, a difference of 0.020%).
| Demographics | Rating | Rank | In Labor Force | Age 20-64 |
| Immigrants | Turkey | 98.5 /100 | #70 | Exceptional 80.2% |
| Soviet Union | 98.5 /100 | #71 | Exceptional 80.2% |
| Eastern Europeans | 98.4 /100 | #72 | Exceptional 80.2% |
| Cypriots | 98.2 /100 | #73 | Exceptional 80.2% |
| Immigrants | Eastern Europe | 98.1 /100 | #74 | Exceptional 80.2% |
| Immigrants | Afghanistan | 97.9 /100 | #75 | Exceptional 80.2% |
| Egyptians | 97.8 /100 | #76 | Exceptional 80.2% |
| Immigrants | Colombia | 97.8 /100 | #77 | Exceptional 80.2% |
| Immigrants | Romania | 97.8 /100 | #78 | Exceptional 80.2% |
| Asians | 97.7 /100 | #79 | Exceptional 80.2% |
| Immigrants | Croatia | 97.6 /100 | #80 | Exceptional 80.1% |
| German Russians | 97.3 /100 | #81 | Exceptional 80.1% |
| Immigrants | Japan | 97.3 /100 | #82 | Exceptional 80.1% |
| Colombians | 97.3 /100 | #83 | Exceptional 80.1% |
| Immigrants | Latvia | 97.2 /100 | #84 | Exceptional 80.1% |