Immigrants from Mexico vs Cypriot 1 or more Vehicles in Household
COMPARE
Immigrants from Mexico
Cypriot
1 or more Vehicles in Household
1 or more Vehicles in Household Comparison
Immigrants from Mexico
Cypriots
91.9%
1 OR MORE VEHICLES IN HOUSEHOLD
99.8/ 100
METRIC RATING
58th/ 347
METRIC RANK
84.4%
1 OR MORE VEHICLES IN HOUSEHOLD
0.0/ 100
METRIC RATING
315th/ 347
METRIC RANK
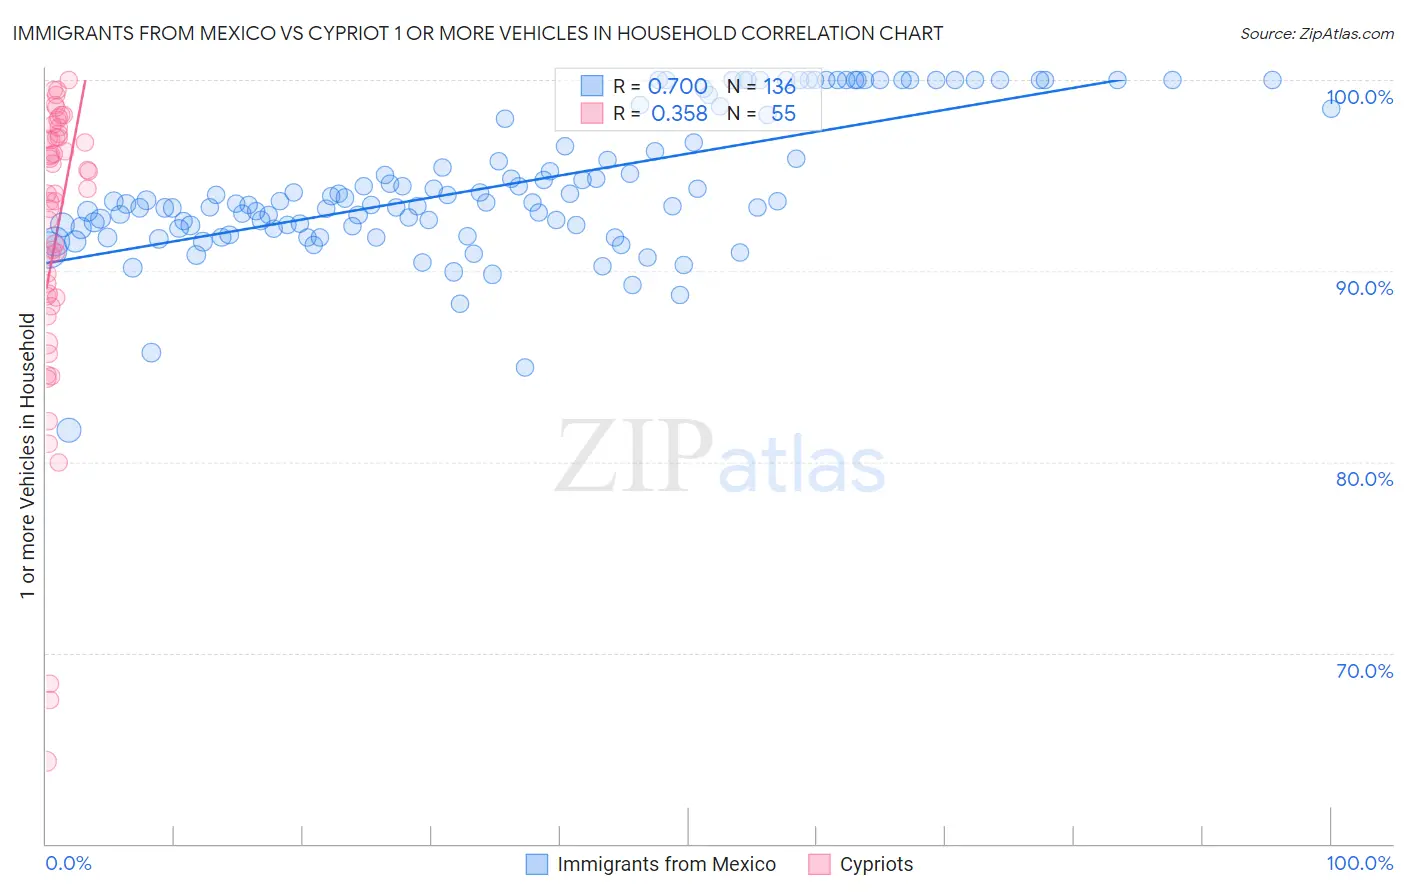
Immigrants from Mexico vs Cypriot 1 or more Vehicles in Household Correlation Chart
The statistical analysis conducted on geographies consisting of 513,448,987 people shows a significant positive correlation between the proportion of Immigrants from Mexico and percentage of households with 1 or more vehicles available in the United States with a correlation coefficient (R) of 0.700 and weighted average of 91.9%. Similarly, the statistical analysis conducted on geographies consisting of 61,854,678 people shows a mild positive correlation between the proportion of Cypriots and percentage of households with 1 or more vehicles available in the United States with a correlation coefficient (R) of 0.358 and weighted average of 84.4%, a difference of 8.9%.
1 or more Vehicles in Household Correlation Summary
| Measurement | Immigrants from Mexico | Cypriot |
| Minimum | 81.7% | 64.3% |
| Maximum | 100.0% | 100.0% |
| Range | 18.3% | 35.7% |
| Mean | 94.5% | 91.6% |
| Median | 93.6% | 94.0% |
| Interquartile 25% (IQ1) | 92.3% | 88.6% |
| Interquartile 75% (IQ3) | 98.1% | 97.0% |
| Interquartile Range (IQR) | 5.8% | 8.4% |
| Standard Deviation (Sample) | 3.7% | 8.0% |
| Standard Deviation (Population) | 3.7% | 7.9% |
Similar Demographics by 1 or more Vehicles in Household
Demographics Similar to Immigrants from Mexico by 1 or more Vehicles in Household
In terms of 1 or more vehicles in household, the demographic groups most similar to Immigrants from Mexico are Venezuelan (91.9%, a difference of 0.010%), Iraqi (91.9%, a difference of 0.020%), Slovak (91.9%, a difference of 0.040%), Immigrants from India (91.9%, a difference of 0.050%), and Thai (91.9%, a difference of 0.050%).
| Demographics | Rating | Rank | 1 or more Vehicles in Household |
| Celtics | 99.9 /100 | #51 | Exceptional 92.1% |
| Koreans | 99.9 /100 | #52 | Exceptional 92.1% |
| Hawaiians | 99.9 /100 | #53 | Exceptional 92.0% |
| Slovenes | 99.9 /100 | #54 | Exceptional 92.0% |
| Immigrants | Afghanistan | 99.9 /100 | #55 | Exceptional 92.0% |
| Immigrants | Venezuela | 99.9 /100 | #56 | Exceptional 92.0% |
| Iraqis | 99.8 /100 | #57 | Exceptional 91.9% |
| Immigrants | Mexico | 99.8 /100 | #58 | Exceptional 91.9% |
| Venezuelans | 99.8 /100 | #59 | Exceptional 91.9% |
| Slovaks | 99.8 /100 | #60 | Exceptional 91.9% |
| Immigrants | India | 99.8 /100 | #61 | Exceptional 91.9% |
| Thais | 99.8 /100 | #62 | Exceptional 91.9% |
| Chinese | 99.8 /100 | #63 | Exceptional 91.9% |
| Croatians | 99.8 /100 | #64 | Exceptional 91.9% |
| Immigrants | Laos | 99.8 /100 | #65 | Exceptional 91.8% |
Demographics Similar to Cypriots by 1 or more Vehicles in Household
In terms of 1 or more vehicles in household, the demographic groups most similar to Cypriots are Albanian (84.4%, a difference of 0.070%), Immigrants from Israel (84.5%, a difference of 0.13%), Cape Verdean (84.5%, a difference of 0.16%), Puerto Rican (84.6%, a difference of 0.27%), and U.S. Virgin Islander (84.6%, a difference of 0.30%).
| Demographics | Rating | Rank | 1 or more Vehicles in Household |
| Immigrants | Belize | 0.0 /100 | #308 | Tragic 84.7% |
| Immigrants | Haiti | 0.0 /100 | #309 | Tragic 84.7% |
| U.S. Virgin Islanders | 0.0 /100 | #310 | Tragic 84.6% |
| Puerto Ricans | 0.0 /100 | #311 | Tragic 84.6% |
| Cape Verdeans | 0.0 /100 | #312 | Tragic 84.5% |
| Immigrants | Israel | 0.0 /100 | #313 | Tragic 84.5% |
| Albanians | 0.0 /100 | #314 | Tragic 84.4% |
| Cypriots | 0.0 /100 | #315 | Tragic 84.4% |
| Alaska Natives | 0.0 /100 | #316 | Tragic 83.8% |
| Ghanaians | 0.0 /100 | #317 | Tragic 83.6% |
| Immigrants | Ghana | 0.0 /100 | #318 | Tragic 83.4% |
| Immigrants | Belarus | 0.0 /100 | #319 | Tragic 83.3% |
| Soviet Union | 0.0 /100 | #320 | Tragic 82.7% |
| Jamaicans | 0.0 /100 | #321 | Tragic 82.1% |
| Immigrants | Cabo Verde | 0.0 /100 | #322 | Tragic 81.6% |