Cajun vs Immigrants from England 4 or more Vehicles in Household
COMPARE
Cajun
Immigrants from England
4 or more Vehicles in Household
4 or more Vehicles in Household Comparison
Cajuns
Immigrants from England
6.0%
4 OR MORE VEHICLES IN HOUSEHOLD
9.2/ 100
METRIC RATING
222nd/ 347
METRIC RANK
6.7%
4 OR MORE VEHICLES IN HOUSEHOLD
92.0/ 100
METRIC RATING
129th/ 347
METRIC RANK
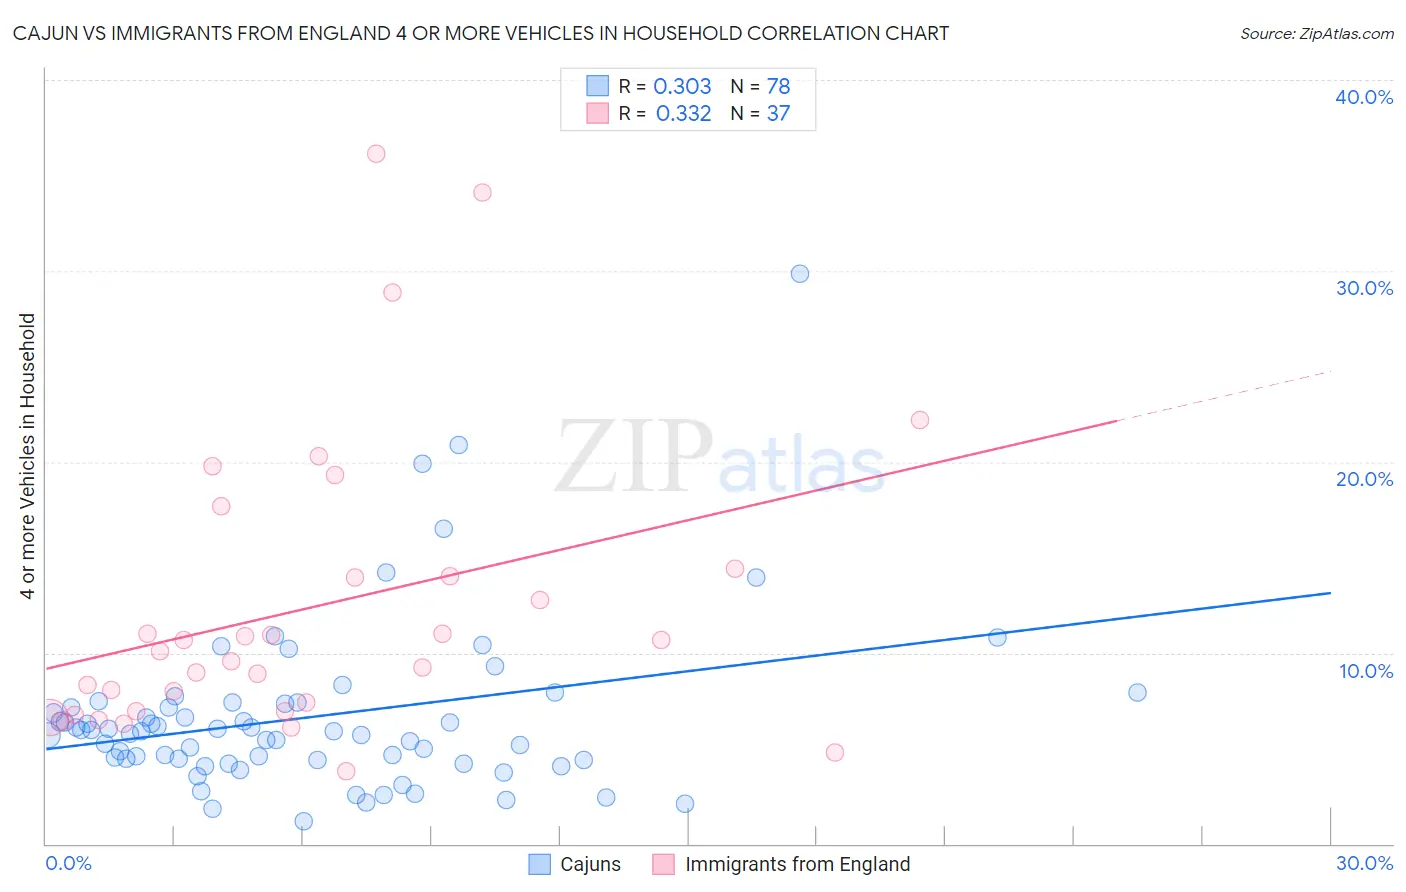
Cajun vs Immigrants from England 4 or more Vehicles in Household Correlation Chart
The statistical analysis conducted on geographies consisting of 149,483,009 people shows a mild positive correlation between the proportion of Cajuns and percentage of households with 4 or more vehicles available in the United States with a correlation coefficient (R) of 0.303 and weighted average of 6.0%. Similarly, the statistical analysis conducted on geographies consisting of 390,499,867 people shows a mild positive correlation between the proportion of Immigrants from England and percentage of households with 4 or more vehicles available in the United States with a correlation coefficient (R) of 0.332 and weighted average of 6.7%, a difference of 12.7%.
4 or more Vehicles in Household Correlation Summary
| Measurement | Cajun | Immigrants from England |
| Minimum | 1.2% | 3.8% |
| Maximum | 29.9% | 36.2% |
| Range | 28.7% | 32.3% |
| Mean | 6.6% | 12.4% |
| Median | 5.9% | 10.1% |
| Interquartile 25% (IQ1) | 4.4% | 6.9% |
| Interquartile 75% (IQ3) | 7.3% | 14.2% |
| Interquartile Range (IQR) | 2.9% | 7.3% |
| Standard Deviation (Sample) | 4.5% | 7.7% |
| Standard Deviation (Population) | 4.4% | 7.6% |
Similar Demographics by 4 or more Vehicles in Household
Demographics Similar to Cajuns by 4 or more Vehicles in Household
In terms of 4 or more vehicles in household, the demographic groups most similar to Cajuns are Immigrants from Kenya (6.0%, a difference of 0.0%), Cuban (6.0%, a difference of 0.010%), Immigrants from Moldova (6.0%, a difference of 0.030%), Indonesian (6.0%, a difference of 0.090%), and Russian (6.0%, a difference of 0.33%).
| Demographics | Rating | Rank | 4 or more Vehicles in Household |
| Immigrants | China | 13.8 /100 | #215 | Poor 6.0% |
| Immigrants | Romania | 13.8 /100 | #216 | Poor 6.0% |
| Nigerians | 12.2 /100 | #217 | Poor 6.0% |
| Immigrants | Italy | 11.0 /100 | #218 | Poor 6.0% |
| Serbians | 11.0 /100 | #219 | Poor 6.0% |
| Russians | 10.3 /100 | #220 | Poor 6.0% |
| Immigrants | Moldova | 9.3 /100 | #221 | Tragic 6.0% |
| Cajuns | 9.2 /100 | #222 | Tragic 6.0% |
| Immigrants | Kenya | 9.2 /100 | #223 | Tragic 6.0% |
| Cubans | 9.2 /100 | #224 | Tragic 6.0% |
| Indonesians | 8.9 /100 | #225 | Tragic 6.0% |
| Immigrants | Singapore | 7.9 /100 | #226 | Tragic 5.9% |
| Immigrants | Western Asia | 7.8 /100 | #227 | Tragic 5.9% |
| Immigrants | Uganda | 7.5 /100 | #228 | Tragic 5.9% |
| Eastern Europeans | 6.8 /100 | #229 | Tragic 5.9% |
Demographics Similar to Immigrants from England by 4 or more Vehicles in Household
In terms of 4 or more vehicles in household, the demographic groups most similar to Immigrants from England are Immigrants from Bolivia (6.7%, a difference of 0.16%), Immigrants from Korea (6.8%, a difference of 0.66%), Austrian (6.8%, a difference of 0.79%), Belgian (6.8%, a difference of 0.79%), and Immigrants from Scotland (6.7%, a difference of 0.83%).
| Demographics | Rating | Rank | 4 or more Vehicles in Household |
| Immigrants | Nicaragua | 94.7 /100 | #122 | Exceptional 6.8% |
| Immigrants | Immigrants | 94.6 /100 | #123 | Exceptional 6.8% |
| Immigrants | Asia | 94.4 /100 | #124 | Exceptional 6.8% |
| Austrians | 94.1 /100 | #125 | Exceptional 6.8% |
| Belgians | 94.1 /100 | #126 | Exceptional 6.8% |
| Immigrants | Korea | 93.8 /100 | #127 | Exceptional 6.8% |
| Immigrants | Bolivia | 92.5 /100 | #128 | Exceptional 6.7% |
| Immigrants | England | 92.0 /100 | #129 | Exceptional 6.7% |
| Immigrants | Scotland | 89.0 /100 | #130 | Excellent 6.7% |
| Maltese | 88.4 /100 | #131 | Excellent 6.7% |
| Immigrants | Netherlands | 87.8 /100 | #132 | Excellent 6.6% |
| Armenians | 86.9 /100 | #133 | Excellent 6.6% |
| Ottawa | 86.9 /100 | #134 | Excellent 6.6% |
| Tohono O'odham | 86.7 /100 | #135 | Excellent 6.6% |
| Luxembourgers | 86.4 /100 | #136 | Excellent 6.6% |