Immigrants from Latvia vs Sudanese No Vehicles in Household
COMPARE
Immigrants from Latvia
Sudanese
No Vehicles in Household
No Vehicles in Household Comparison
Immigrants from Latvia
Sudanese
12.1%
NO VEHICLES IN HOUSEHOLD
0.8/ 100
METRIC RATING
259th/ 347
METRIC RANK
9.8%
NO VEHICLES IN HOUSEHOLD
83.1/ 100
METRIC RATING
141st/ 347
METRIC RANK
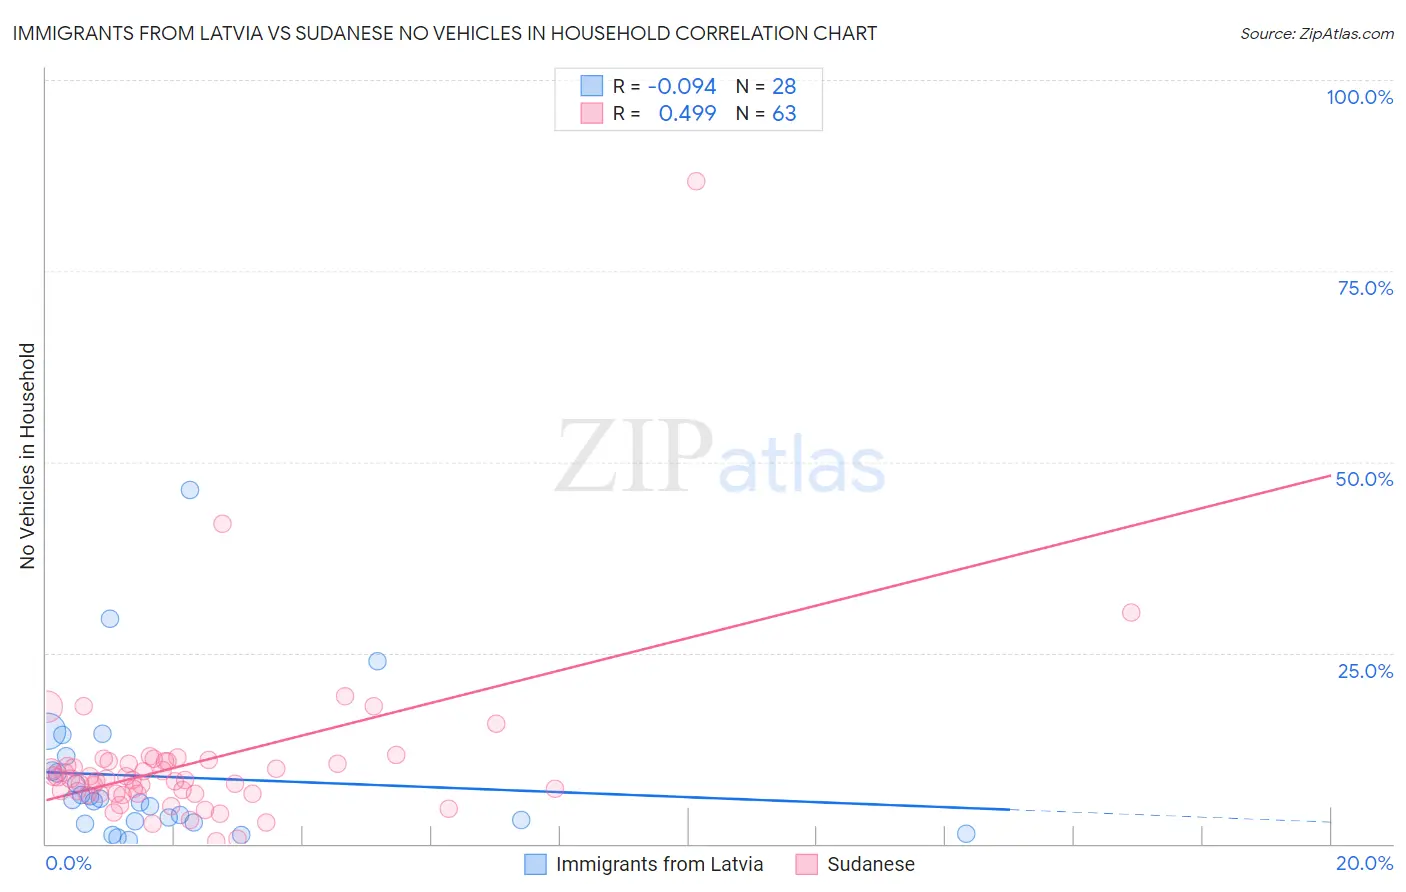
Immigrants from Latvia vs Sudanese No Vehicles in Household Correlation Chart
The statistical analysis conducted on geographies consisting of 113,705,048 people shows a slight negative correlation between the proportion of Immigrants from Latvia and percentage of households with no vehicle available in the United States with a correlation coefficient (R) of -0.094 and weighted average of 12.1%. Similarly, the statistical analysis conducted on geographies consisting of 110,072,180 people shows a moderate positive correlation between the proportion of Sudanese and percentage of households with no vehicle available in the United States with a correlation coefficient (R) of 0.499 and weighted average of 9.8%, a difference of 22.9%.
No Vehicles in Household Correlation Summary
| Measurement | Immigrants from Latvia | Sudanese |
| Minimum | 0.43% | 0.33% |
| Maximum | 46.2% | 86.7% |
| Range | 45.8% | 86.3% |
| Mean | 8.7% | 10.6% |
| Median | 5.7% | 8.4% |
| Interquartile 25% (IQ1) | 2.8% | 6.6% |
| Interquartile 75% (IQ3) | 10.5% | 10.8% |
| Interquartile Range (IQR) | 7.7% | 4.2% |
| Standard Deviation (Sample) | 10.1% | 11.6% |
| Standard Deviation (Population) | 9.9% | 11.5% |
Similar Demographics by No Vehicles in Household
Demographics Similar to Immigrants from Latvia by No Vehicles in Household
In terms of no vehicles in household, the demographic groups most similar to Immigrants from Latvia are South American Indian (12.1%, a difference of 0.24%), Nigerian (12.1%, a difference of 0.26%), Macedonian (12.2%, a difference of 0.55%), Subsaharan African (12.2%, a difference of 0.95%), and Liberian (12.0%, a difference of 1.0%).
| Demographics | Rating | Rank | No Vehicles in Household |
| Immigrants | Serbia | 1.5 /100 | #252 | Tragic 11.9% |
| Egyptians | 1.4 /100 | #253 | Tragic 11.9% |
| Immigrants | Uruguay | 1.3 /100 | #254 | Tragic 11.9% |
| Hondurans | 1.2 /100 | #255 | Tragic 12.0% |
| Liberians | 1.2 /100 | #256 | Tragic 12.0% |
| Nigerians | 0.9 /100 | #257 | Tragic 12.1% |
| South American Indians | 0.9 /100 | #258 | Tragic 12.1% |
| Immigrants | Latvia | 0.8 /100 | #259 | Tragic 12.1% |
| Macedonians | 0.7 /100 | #260 | Tragic 12.2% |
| Sub-Saharan Africans | 0.6 /100 | #261 | Tragic 12.2% |
| Immigrants | Liberia | 0.6 /100 | #262 | Tragic 12.2% |
| Immigrants | Egypt | 0.6 /100 | #263 | Tragic 12.2% |
| Immigrants | Switzerland | 0.5 /100 | #264 | Tragic 12.3% |
| Africans | 0.4 /100 | #265 | Tragic 12.3% |
| Israelis | 0.3 /100 | #266 | Tragic 12.4% |
Demographics Similar to Sudanese by No Vehicles in Household
In terms of no vehicles in household, the demographic groups most similar to Sudanese are Immigrants from Zimbabwe (9.9%, a difference of 0.13%), Immigrants from Lithuania (9.8%, a difference of 0.22%), Marshallese (9.8%, a difference of 0.23%), Estonian (9.8%, a difference of 0.27%), and Immigrants from Moldova (9.8%, a difference of 0.39%).
| Demographics | Rating | Rank | No Vehicles in Household |
| Syrians | 87.1 /100 | #134 | Excellent 9.7% |
| Latvians | 85.1 /100 | #135 | Excellent 9.8% |
| Immigrants | South Africa | 85.0 /100 | #136 | Excellent 9.8% |
| Immigrants | Moldova | 84.6 /100 | #137 | Excellent 9.8% |
| Estonians | 84.2 /100 | #138 | Excellent 9.8% |
| Marshallese | 84.0 /100 | #139 | Excellent 9.8% |
| Immigrants | Lithuania | 84.0 /100 | #140 | Excellent 9.8% |
| Sudanese | 83.1 /100 | #141 | Excellent 9.8% |
| Immigrants | Zimbabwe | 82.6 /100 | #142 | Excellent 9.9% |
| Chileans | 81.2 /100 | #143 | Excellent 9.9% |
| Immigrants | Bahamas | 81.2 /100 | #144 | Excellent 9.9% |
| Bahamians | 81.0 /100 | #145 | Excellent 9.9% |
| Hungarians | 80.0 /100 | #146 | Excellent 9.9% |
| Immigrants | Nicaragua | 79.8 /100 | #147 | Good 9.9% |
| Immigrants | Bosnia and Herzegovina | 79.1 /100 | #148 | Good 9.9% |