Immigrants from Latvia vs Immigrants from Fiji No Vehicles in Household
COMPARE
Immigrants from Latvia
Immigrants from Fiji
No Vehicles in Household
No Vehicles in Household Comparison
Immigrants from Latvia
Immigrants from Fiji
12.1%
NO VEHICLES IN HOUSEHOLD
0.8/ 100
METRIC RATING
259th/ 347
METRIC RANK
7.8%
NO VEHICLES IN HOUSEHOLD
99.9/ 100
METRIC RATING
39th/ 347
METRIC RANK
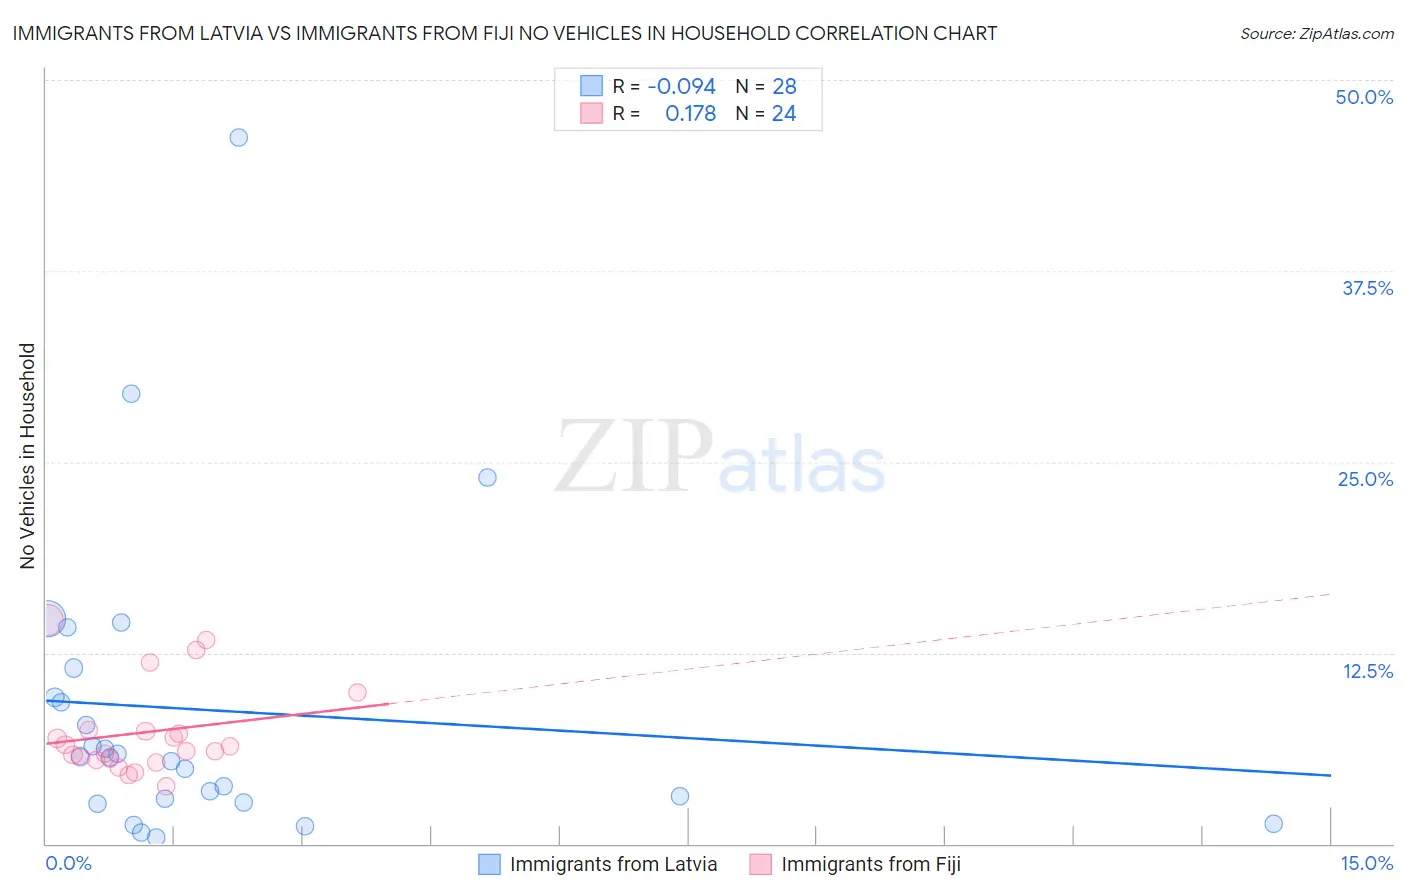
Immigrants from Latvia vs Immigrants from Fiji No Vehicles in Household Correlation Chart
The statistical analysis conducted on geographies consisting of 113,705,048 people shows a slight negative correlation between the proportion of Immigrants from Latvia and percentage of households with no vehicle available in the United States with a correlation coefficient (R) of -0.094 and weighted average of 12.1%. Similarly, the statistical analysis conducted on geographies consisting of 93,723,528 people shows a poor positive correlation between the proportion of Immigrants from Fiji and percentage of households with no vehicle available in the United States with a correlation coefficient (R) of 0.178 and weighted average of 7.8%, a difference of 54.6%.
No Vehicles in Household Correlation Summary
| Measurement | Immigrants from Latvia | Immigrants from Fiji |
| Minimum | 0.43% | 3.8% |
| Maximum | 46.2% | 14.7% |
| Range | 45.8% | 10.9% |
| Mean | 8.7% | 7.3% |
| Median | 5.7% | 6.2% |
| Interquartile 25% (IQ1) | 2.8% | 5.5% |
| Interquartile 75% (IQ3) | 10.5% | 7.4% |
| Interquartile Range (IQR) | 7.7% | 1.9% |
| Standard Deviation (Sample) | 10.1% | 3.0% |
| Standard Deviation (Population) | 9.9% | 2.9% |
Similar Demographics by No Vehicles in Household
Demographics Similar to Immigrants from Latvia by No Vehicles in Household
In terms of no vehicles in household, the demographic groups most similar to Immigrants from Latvia are South American Indian (12.1%, a difference of 0.24%), Nigerian (12.1%, a difference of 0.26%), Macedonian (12.2%, a difference of 0.55%), Subsaharan African (12.2%, a difference of 0.95%), and Liberian (12.0%, a difference of 1.0%).
| Demographics | Rating | Rank | No Vehicles in Household |
| Immigrants | Serbia | 1.5 /100 | #252 | Tragic 11.9% |
| Egyptians | 1.4 /100 | #253 | Tragic 11.9% |
| Immigrants | Uruguay | 1.3 /100 | #254 | Tragic 11.9% |
| Hondurans | 1.2 /100 | #255 | Tragic 12.0% |
| Liberians | 1.2 /100 | #256 | Tragic 12.0% |
| Nigerians | 0.9 /100 | #257 | Tragic 12.1% |
| South American Indians | 0.9 /100 | #258 | Tragic 12.1% |
| Immigrants | Latvia | 0.8 /100 | #259 | Tragic 12.1% |
| Macedonians | 0.7 /100 | #260 | Tragic 12.2% |
| Sub-Saharan Africans | 0.6 /100 | #261 | Tragic 12.2% |
| Immigrants | Liberia | 0.6 /100 | #262 | Tragic 12.2% |
| Immigrants | Egypt | 0.6 /100 | #263 | Tragic 12.2% |
| Immigrants | Switzerland | 0.5 /100 | #264 | Tragic 12.3% |
| Africans | 0.4 /100 | #265 | Tragic 12.3% |
| Israelis | 0.3 /100 | #266 | Tragic 12.4% |
Demographics Similar to Immigrants from Fiji by No Vehicles in Household
In terms of no vehicles in household, the demographic groups most similar to Immigrants from Fiji are Czechoslovakian (7.8%, a difference of 0.10%), French Canadian (7.8%, a difference of 0.24%), Swiss (7.9%, a difference of 0.38%), Chickasaw (7.9%, a difference of 0.46%), and Creek (7.8%, a difference of 0.58%).
| Demographics | Rating | Rank | No Vehicles in Household |
| Malaysians | 100.0 /100 | #32 | Exceptional 7.7% |
| Immigrants | Taiwan | 100.0 /100 | #33 | Exceptional 7.7% |
| Immigrants | Vietnam | 100.0 /100 | #34 | Exceptional 7.7% |
| Cherokee | 99.9 /100 | #35 | Exceptional 7.7% |
| Iraqis | 99.9 /100 | #36 | Exceptional 7.7% |
| Basques | 99.9 /100 | #37 | Exceptional 7.8% |
| Creek | 99.9 /100 | #38 | Exceptional 7.8% |
| Immigrants | Fiji | 99.9 /100 | #39 | Exceptional 7.8% |
| Czechoslovakians | 99.9 /100 | #40 | Exceptional 7.8% |
| French Canadians | 99.9 /100 | #41 | Exceptional 7.8% |
| Swiss | 99.9 /100 | #42 | Exceptional 7.9% |
| Chickasaw | 99.9 /100 | #43 | Exceptional 7.9% |
| Choctaw | 99.9 /100 | #44 | Exceptional 7.9% |
| Immigrants | Nonimmigrants | 99.9 /100 | #45 | Exceptional 7.9% |
| Spanish | 99.9 /100 | #46 | Exceptional 7.9% |