Icelander vs Immigrants from West Indies 1 or more Vehicles in Household
COMPARE
Icelander
Immigrants from West Indies
1 or more Vehicles in Household
1 or more Vehicles in Household Comparison
Icelanders
Immigrants from West Indies
90.5%
1 OR MORE VEHICLES IN HOUSEHOLD
92.1/ 100
METRIC RATING
121st/ 347
METRIC RANK
79.5%
1 OR MORE VEHICLES IN HOUSEHOLD
0.0/ 100
METRIC RATING
326th/ 347
METRIC RANK
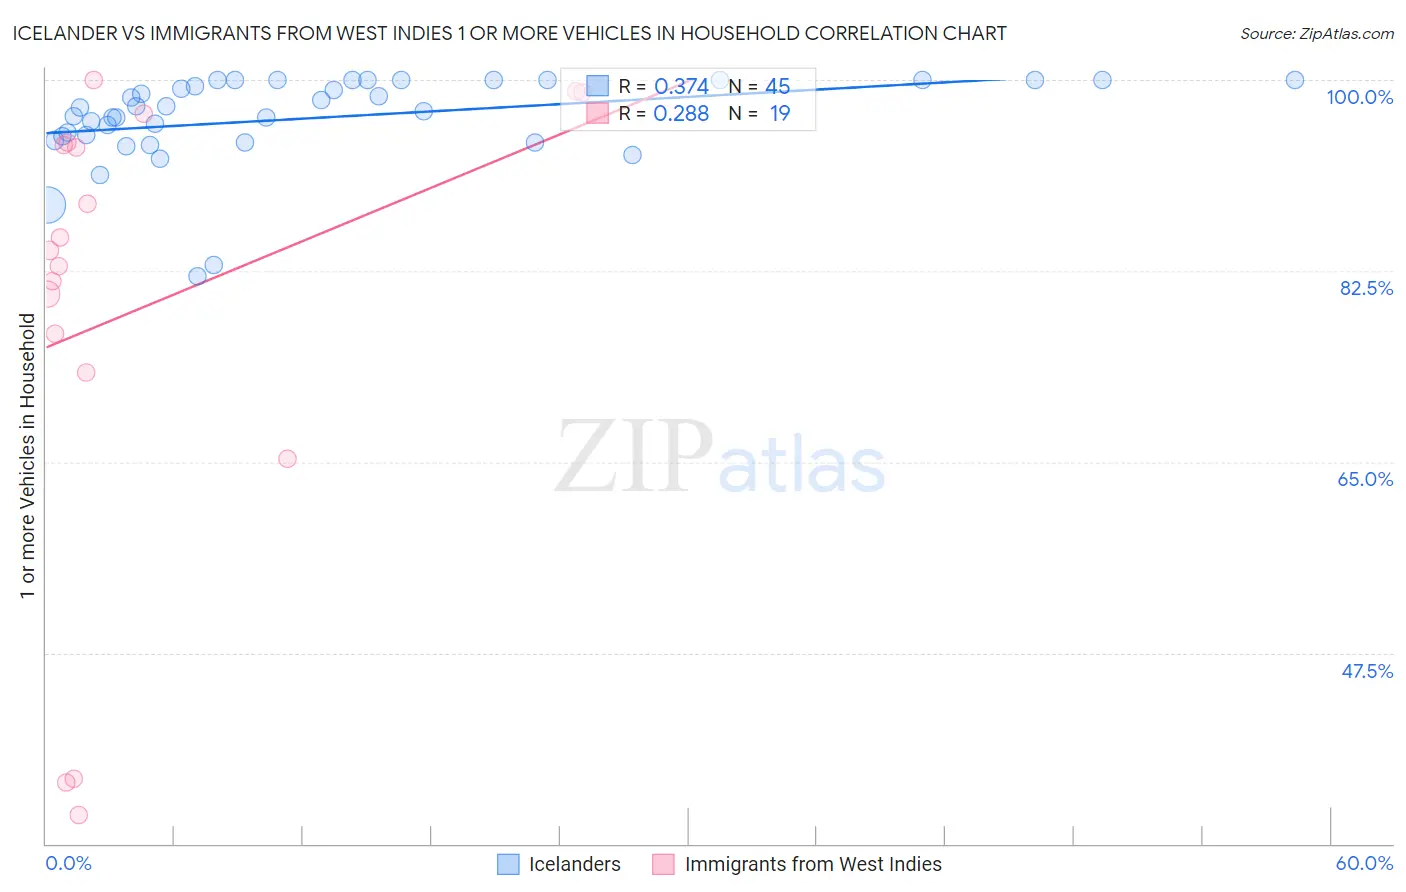
Icelander vs Immigrants from West Indies 1 or more Vehicles in Household Correlation Chart
The statistical analysis conducted on geographies consisting of 159,626,403 people shows a mild positive correlation between the proportion of Icelanders and percentage of households with 1 or more vehicles available in the United States with a correlation coefficient (R) of 0.374 and weighted average of 90.5%. Similarly, the statistical analysis conducted on geographies consisting of 72,454,628 people shows a weak positive correlation between the proportion of Immigrants from West Indies and percentage of households with 1 or more vehicles available in the United States with a correlation coefficient (R) of 0.288 and weighted average of 79.5%, a difference of 13.9%.
1 or more Vehicles in Household Correlation Summary
| Measurement | Icelander | Immigrants from West Indies |
| Minimum | 82.1% | 32.7% |
| Maximum | 100.0% | 100.0% |
| Range | 17.9% | 67.3% |
| Mean | 96.5% | 78.9% |
| Median | 97.5% | 84.4% |
| Interquartile 25% (IQ1) | 94.7% | 73.2% |
| Interquartile 75% (IQ3) | 100.0% | 94.3% |
| Interquartile Range (IQR) | 5.3% | 21.1% |
| Standard Deviation (Sample) | 4.1% | 21.8% |
| Standard Deviation (Population) | 4.1% | 21.2% |
Similar Demographics by 1 or more Vehicles in Household
Demographics Similar to Icelanders by 1 or more Vehicles in Household
In terms of 1 or more vehicles in household, the demographic groups most similar to Icelanders are Immigrants from Thailand (90.6%, a difference of 0.010%), Costa Rican (90.5%, a difference of 0.010%), Fijian (90.5%, a difference of 0.010%), Blackfeet (90.6%, a difference of 0.030%), and Puget Sound Salish (90.5%, a difference of 0.030%).
| Demographics | Rating | Rank | 1 or more Vehicles in Household |
| Armenians | 94.5 /100 | #114 | Exceptional 90.7% |
| Serbians | 94.3 /100 | #115 | Exceptional 90.7% |
| Chippewa | 94.3 /100 | #116 | Exceptional 90.7% |
| Greeks | 93.5 /100 | #117 | Exceptional 90.6% |
| Japanese | 93.4 /100 | #118 | Exceptional 90.6% |
| Blackfeet | 92.6 /100 | #119 | Exceptional 90.6% |
| Immigrants | Thailand | 92.3 /100 | #120 | Exceptional 90.6% |
| Icelanders | 92.1 /100 | #121 | Exceptional 90.5% |
| Costa Ricans | 92.0 /100 | #122 | Exceptional 90.5% |
| Fijians | 91.8 /100 | #123 | Exceptional 90.5% |
| Puget Sound Salish | 91.5 /100 | #124 | Exceptional 90.5% |
| Immigrants | Korea | 90.5 /100 | #125 | Exceptional 90.5% |
| Immigrants | Cameroon | 89.4 /100 | #126 | Excellent 90.4% |
| Immigrants | Azores | 89.1 /100 | #127 | Excellent 90.4% |
| Burmese | 89.0 /100 | #128 | Excellent 90.4% |
Demographics Similar to Immigrants from West Indies by 1 or more Vehicles in Household
In terms of 1 or more vehicles in household, the demographic groups most similar to Immigrants from West Indies are Immigrants from Senegal (79.0%, a difference of 0.63%), Senegalese (80.4%, a difference of 1.1%), Immigrants from Caribbean (80.4%, a difference of 1.2%), Immigrants from Yemen (80.5%, a difference of 1.3%), and Ecuadorian (77.9%, a difference of 2.0%).
| Demographics | Rating | Rank | 1 or more Vehicles in Household |
| Immigrants | Belarus | 0.0 /100 | #319 | Tragic 83.3% |
| Soviet Union | 0.0 /100 | #320 | Tragic 82.7% |
| Jamaicans | 0.0 /100 | #321 | Tragic 82.1% |
| Immigrants | Cabo Verde | 0.0 /100 | #322 | Tragic 81.6% |
| Immigrants | Yemen | 0.0 /100 | #323 | Tragic 80.5% |
| Immigrants | Caribbean | 0.0 /100 | #324 | Tragic 80.4% |
| Senegalese | 0.0 /100 | #325 | Tragic 80.4% |
| Immigrants | West Indies | 0.0 /100 | #326 | Tragic 79.5% |
| Immigrants | Senegal | 0.0 /100 | #327 | Tragic 79.0% |
| Ecuadorians | 0.0 /100 | #328 | Tragic 77.9% |
| Immigrants | Dominica | 0.0 /100 | #329 | Tragic 77.8% |
| Immigrants | Trinidad and Tobago | 0.0 /100 | #330 | Tragic 76.8% |
| West Indians | 0.0 /100 | #331 | Tragic 76.4% |
| Trinidadians and Tobagonians | 0.0 /100 | #332 | Tragic 76.3% |
| Immigrants | Ecuador | 0.0 /100 | #333 | Tragic 76.2% |