Immigrants from Africa vs Immigrants from West Indies 1 or more Vehicles in Household
COMPARE
Immigrants from Africa
Immigrants from West Indies
1 or more Vehicles in Household
1 or more Vehicles in Household Comparison
Immigrants from Africa
Immigrants from West Indies
87.6%
1 OR MORE VEHICLES IN HOUSEHOLD
0.2/ 100
METRIC RATING
269th/ 347
METRIC RANK
79.5%
1 OR MORE VEHICLES IN HOUSEHOLD
0.0/ 100
METRIC RATING
326th/ 347
METRIC RANK
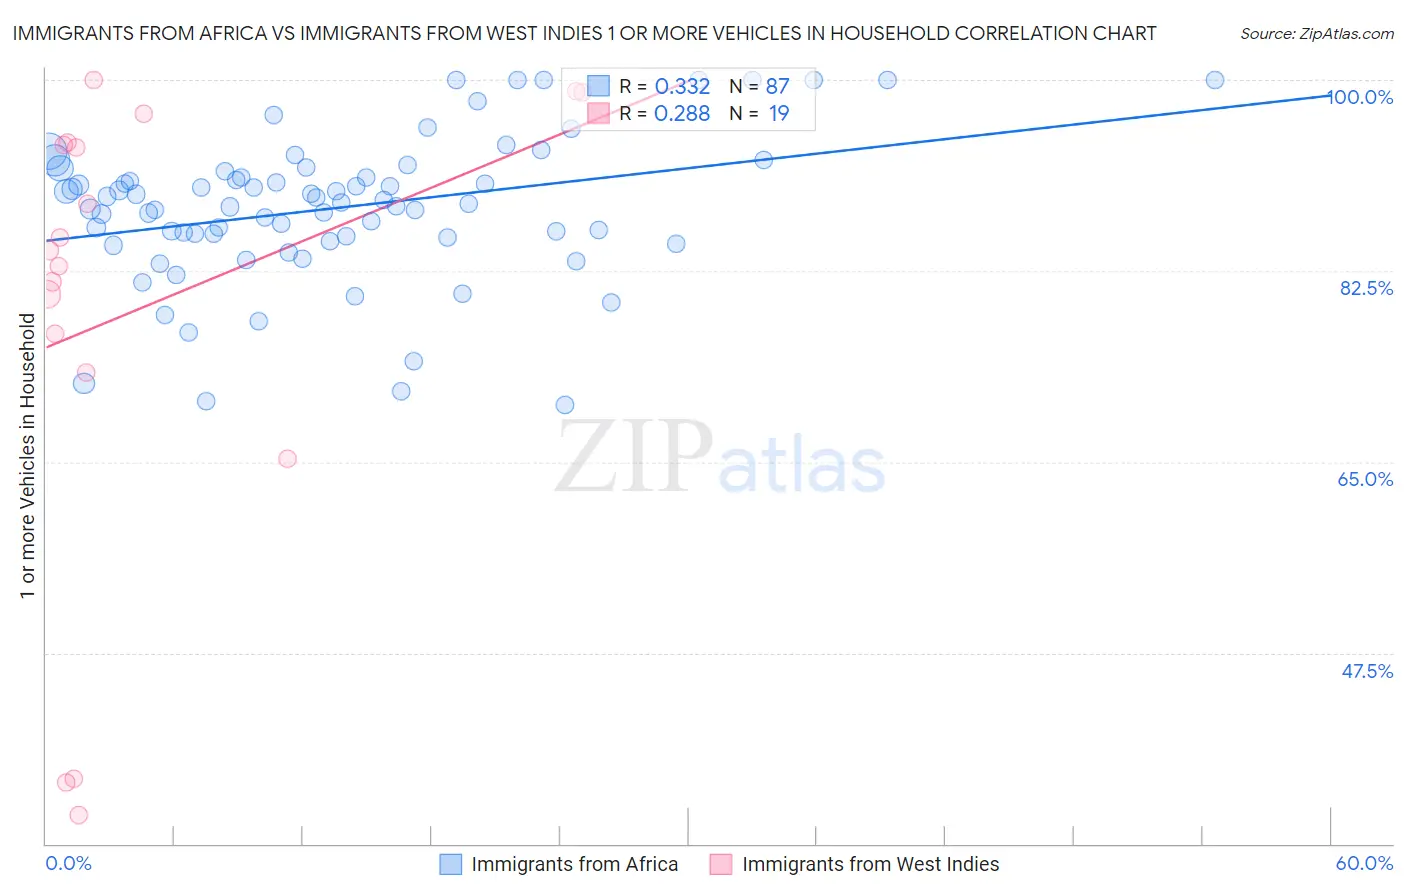
Immigrants from Africa vs Immigrants from West Indies 1 or more Vehicles in Household Correlation Chart
The statistical analysis conducted on geographies consisting of 468,980,674 people shows a mild positive correlation between the proportion of Immigrants from Africa and percentage of households with 1 or more vehicles available in the United States with a correlation coefficient (R) of 0.332 and weighted average of 87.6%. Similarly, the statistical analysis conducted on geographies consisting of 72,454,628 people shows a weak positive correlation between the proportion of Immigrants from West Indies and percentage of households with 1 or more vehicles available in the United States with a correlation coefficient (R) of 0.288 and weighted average of 79.5%, a difference of 10.2%.
1 or more Vehicles in Household Correlation Summary
| Measurement | Immigrants from Africa | Immigrants from West Indies |
| Minimum | 70.3% | 32.7% |
| Maximum | 100.0% | 100.0% |
| Range | 29.7% | 67.3% |
| Mean | 88.3% | 78.9% |
| Median | 88.8% | 84.4% |
| Interquartile 25% (IQ1) | 85.6% | 73.2% |
| Interquartile 75% (IQ3) | 91.6% | 94.3% |
| Interquartile Range (IQR) | 6.0% | 21.1% |
| Standard Deviation (Sample) | 6.7% | 21.8% |
| Standard Deviation (Population) | 6.7% | 21.2% |
Similar Demographics by 1 or more Vehicles in Household
Demographics Similar to Immigrants from Africa by 1 or more Vehicles in Household
In terms of 1 or more vehicles in household, the demographic groups most similar to Immigrants from Africa are Panamanian (87.5%, a difference of 0.010%), Bermudan (87.5%, a difference of 0.020%), Immigrants from Europe (87.6%, a difference of 0.050%), Immigrants from Colombia (87.6%, a difference of 0.080%), and Aleut (87.5%, a difference of 0.080%).
| Demographics | Rating | Rank | 1 or more Vehicles in Household |
| Sub-Saharan Africans | 0.5 /100 | #262 | Tragic 87.9% |
| Immigrants | Egypt | 0.5 /100 | #263 | Tragic 87.8% |
| Immigrants | Liberia | 0.4 /100 | #264 | Tragic 87.8% |
| Africans | 0.4 /100 | #265 | Tragic 87.8% |
| Israelis | 0.3 /100 | #266 | Tragic 87.7% |
| Immigrants | Colombia | 0.3 /100 | #267 | Tragic 87.6% |
| Immigrants | Europe | 0.2 /100 | #268 | Tragic 87.6% |
| Immigrants | Africa | 0.2 /100 | #269 | Tragic 87.6% |
| Panamanians | 0.2 /100 | #270 | Tragic 87.5% |
| Bermudans | 0.2 /100 | #271 | Tragic 87.5% |
| Aleuts | 0.2 /100 | #272 | Tragic 87.5% |
| Immigrants | Northern Africa | 0.2 /100 | #273 | Tragic 87.4% |
| Immigrants | Morocco | 0.1 /100 | #274 | Tragic 87.4% |
| Immigrants | Singapore | 0.1 /100 | #275 | Tragic 87.2% |
| Immigrants | France | 0.1 /100 | #276 | Tragic 87.1% |
Demographics Similar to Immigrants from West Indies by 1 or more Vehicles in Household
In terms of 1 or more vehicles in household, the demographic groups most similar to Immigrants from West Indies are Immigrants from Senegal (79.0%, a difference of 0.63%), Senegalese (80.4%, a difference of 1.1%), Immigrants from Caribbean (80.4%, a difference of 1.2%), Immigrants from Yemen (80.5%, a difference of 1.3%), and Ecuadorian (77.9%, a difference of 2.0%).
| Demographics | Rating | Rank | 1 or more Vehicles in Household |
| Immigrants | Belarus | 0.0 /100 | #319 | Tragic 83.3% |
| Soviet Union | 0.0 /100 | #320 | Tragic 82.7% |
| Jamaicans | 0.0 /100 | #321 | Tragic 82.1% |
| Immigrants | Cabo Verde | 0.0 /100 | #322 | Tragic 81.6% |
| Immigrants | Yemen | 0.0 /100 | #323 | Tragic 80.5% |
| Immigrants | Caribbean | 0.0 /100 | #324 | Tragic 80.4% |
| Senegalese | 0.0 /100 | #325 | Tragic 80.4% |
| Immigrants | West Indies | 0.0 /100 | #326 | Tragic 79.5% |
| Immigrants | Senegal | 0.0 /100 | #327 | Tragic 79.0% |
| Ecuadorians | 0.0 /100 | #328 | Tragic 77.9% |
| Immigrants | Dominica | 0.0 /100 | #329 | Tragic 77.8% |
| Immigrants | Trinidad and Tobago | 0.0 /100 | #330 | Tragic 76.8% |
| West Indians | 0.0 /100 | #331 | Tragic 76.4% |
| Trinidadians and Tobagonians | 0.0 /100 | #332 | Tragic 76.3% |
| Immigrants | Ecuador | 0.0 /100 | #333 | Tragic 76.2% |