Immigrants from Kenya vs Immigrants from Africa 1 or more Vehicles in Household
COMPARE
Immigrants from Kenya
Immigrants from Africa
1 or more Vehicles in Household
1 or more Vehicles in Household Comparison
Immigrants from Kenya
Immigrants from Africa
90.4%
1 OR MORE VEHICLES IN HOUSEHOLD
88.5/ 100
METRIC RATING
131st/ 347
METRIC RANK
87.6%
1 OR MORE VEHICLES IN HOUSEHOLD
0.2/ 100
METRIC RATING
269th/ 347
METRIC RANK
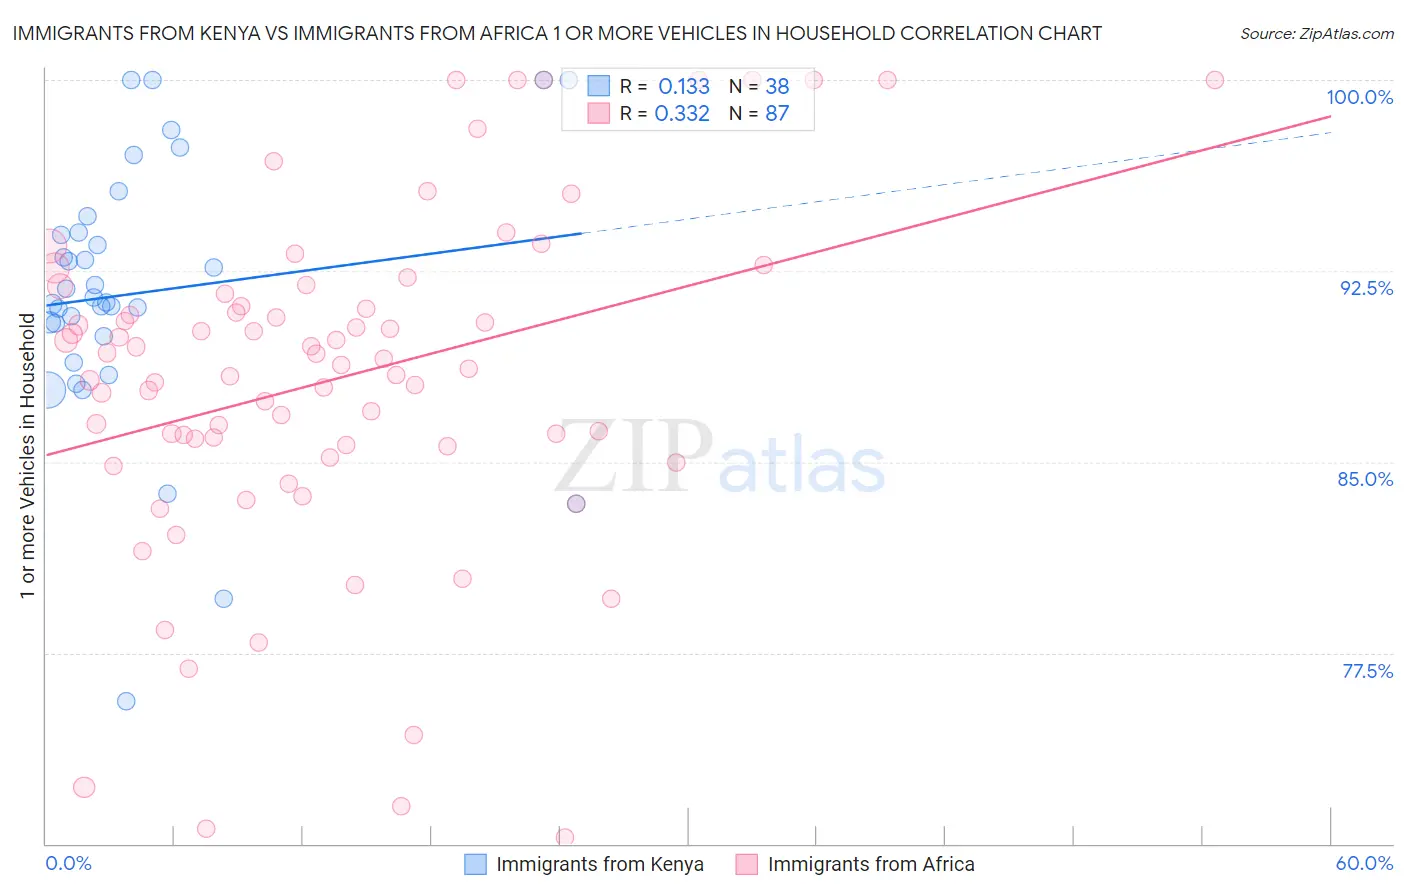
Immigrants from Kenya vs Immigrants from Africa 1 or more Vehicles in Household Correlation Chart
The statistical analysis conducted on geographies consisting of 217,997,711 people shows a poor positive correlation between the proportion of Immigrants from Kenya and percentage of households with 1 or more vehicles available in the United States with a correlation coefficient (R) of 0.133 and weighted average of 90.4%. Similarly, the statistical analysis conducted on geographies consisting of 468,980,674 people shows a mild positive correlation between the proportion of Immigrants from Africa and percentage of households with 1 or more vehicles available in the United States with a correlation coefficient (R) of 0.332 and weighted average of 87.6%, a difference of 3.3%.
1 or more Vehicles in Household Correlation Summary
| Measurement | Immigrants from Kenya | Immigrants from Africa |
| Minimum | 75.6% | 70.3% |
| Maximum | 100.0% | 100.0% |
| Range | 24.4% | 29.7% |
| Mean | 91.6% | 88.3% |
| Median | 91.4% | 88.8% |
| Interquartile 25% (IQ1) | 89.9% | 85.6% |
| Interquartile 75% (IQ3) | 94.0% | 91.6% |
| Interquartile Range (IQR) | 4.1% | 6.0% |
| Standard Deviation (Sample) | 5.3% | 6.7% |
| Standard Deviation (Population) | 5.2% | 6.7% |
Similar Demographics by 1 or more Vehicles in Household
Demographics Similar to Immigrants from Kenya by 1 or more Vehicles in Household
In terms of 1 or more vehicles in household, the demographic groups most similar to Immigrants from Kenya are Nicaraguan (90.4%, a difference of 0.010%), Immigrants from South Africa (90.4%, a difference of 0.010%), Immigrants from the Azores (90.4%, a difference of 0.020%), Burmese (90.4%, a difference of 0.020%), and Marshallese (90.4%, a difference of 0.020%).
| Demographics | Rating | Rank | 1 or more Vehicles in Household |
| Puget Sound Salish | 91.5 /100 | #124 | Exceptional 90.5% |
| Immigrants | Korea | 90.5 /100 | #125 | Exceptional 90.5% |
| Immigrants | Cameroon | 89.4 /100 | #126 | Excellent 90.4% |
| Immigrants | Azores | 89.1 /100 | #127 | Excellent 90.4% |
| Burmese | 89.0 /100 | #128 | Excellent 90.4% |
| Marshallese | 88.9 /100 | #129 | Excellent 90.4% |
| Nicaraguans | 88.8 /100 | #130 | Excellent 90.4% |
| Immigrants | Kenya | 88.5 /100 | #131 | Excellent 90.4% |
| Immigrants | South Africa | 88.1 /100 | #132 | Excellent 90.4% |
| Immigrants | Syria | 87.5 /100 | #133 | Excellent 90.4% |
| Kenyans | 87.0 /100 | #134 | Excellent 90.4% |
| Immigrants | Oceania | 86.9 /100 | #135 | Excellent 90.4% |
| Hungarians | 86.5 /100 | #136 | Excellent 90.3% |
| Latvians | 86.3 /100 | #137 | Excellent 90.3% |
| Syrians | 86.3 /100 | #138 | Excellent 90.3% |
Demographics Similar to Immigrants from Africa by 1 or more Vehicles in Household
In terms of 1 or more vehicles in household, the demographic groups most similar to Immigrants from Africa are Panamanian (87.5%, a difference of 0.010%), Bermudan (87.5%, a difference of 0.020%), Immigrants from Europe (87.6%, a difference of 0.050%), Immigrants from Colombia (87.6%, a difference of 0.080%), and Aleut (87.5%, a difference of 0.080%).
| Demographics | Rating | Rank | 1 or more Vehicles in Household |
| Sub-Saharan Africans | 0.5 /100 | #262 | Tragic 87.9% |
| Immigrants | Egypt | 0.5 /100 | #263 | Tragic 87.8% |
| Immigrants | Liberia | 0.4 /100 | #264 | Tragic 87.8% |
| Africans | 0.4 /100 | #265 | Tragic 87.8% |
| Israelis | 0.3 /100 | #266 | Tragic 87.7% |
| Immigrants | Colombia | 0.3 /100 | #267 | Tragic 87.6% |
| Immigrants | Europe | 0.2 /100 | #268 | Tragic 87.6% |
| Immigrants | Africa | 0.2 /100 | #269 | Tragic 87.6% |
| Panamanians | 0.2 /100 | #270 | Tragic 87.5% |
| Bermudans | 0.2 /100 | #271 | Tragic 87.5% |
| Aleuts | 0.2 /100 | #272 | Tragic 87.5% |
| Immigrants | Northern Africa | 0.2 /100 | #273 | Tragic 87.4% |
| Immigrants | Morocco | 0.1 /100 | #274 | Tragic 87.4% |
| Immigrants | Singapore | 0.1 /100 | #275 | Tragic 87.2% |
| Immigrants | France | 0.1 /100 | #276 | Tragic 87.1% |