Immigrants from Kenya vs Immigrants from Central America 1 or more Vehicles in Household
COMPARE
Immigrants from Kenya
Immigrants from Central America
1 or more Vehicles in Household
1 or more Vehicles in Household Comparison
Immigrants from Kenya
Immigrants from Central America
90.4%
1 OR MORE VEHICLES IN HOUSEHOLD
88.5/ 100
METRIC RATING
131st/ 347
METRIC RANK
91.1%
1 OR MORE VEHICLES IN HOUSEHOLD
98.4/ 100
METRIC RATING
100th/ 347
METRIC RANK
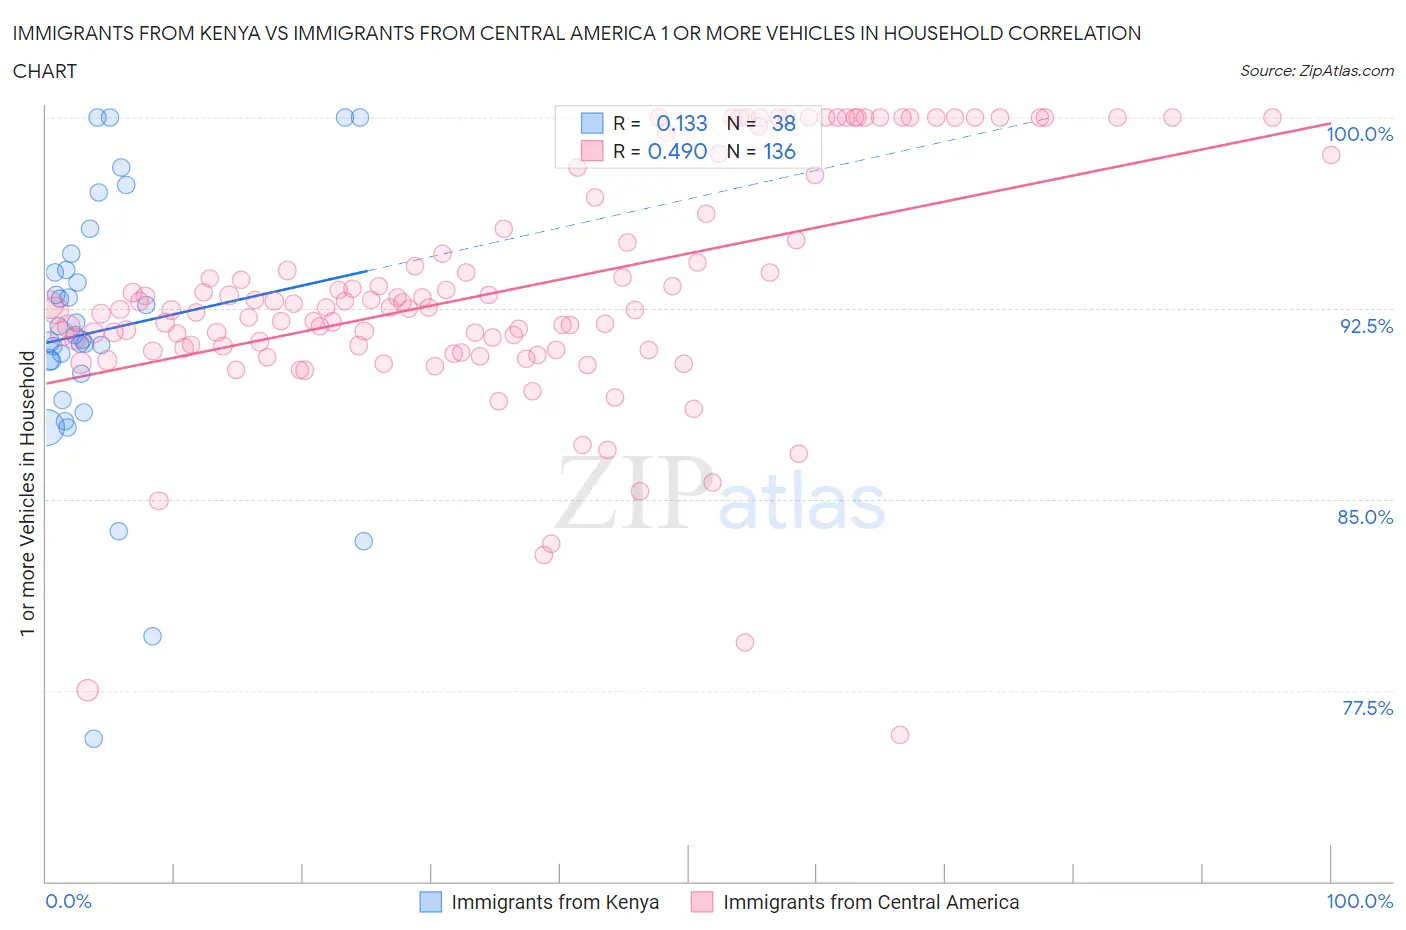
Immigrants from Kenya vs Immigrants from Central America 1 or more Vehicles in Household Correlation Chart
The statistical analysis conducted on geographies consisting of 217,997,711 people shows a poor positive correlation between the proportion of Immigrants from Kenya and percentage of households with 1 or more vehicles available in the United States with a correlation coefficient (R) of 0.133 and weighted average of 90.4%. Similarly, the statistical analysis conducted on geographies consisting of 536,152,360 people shows a moderate positive correlation between the proportion of Immigrants from Central America and percentage of households with 1 or more vehicles available in the United States with a correlation coefficient (R) of 0.490 and weighted average of 91.1%, a difference of 0.81%.
1 or more Vehicles in Household Correlation Summary
| Measurement | Immigrants from Kenya | Immigrants from Central America |
| Minimum | 75.6% | 75.8% |
| Maximum | 100.0% | 100.0% |
| Range | 24.4% | 24.2% |
| Mean | 91.6% | 93.2% |
| Median | 91.4% | 92.5% |
| Interquartile 25% (IQ1) | 89.9% | 91.0% |
| Interquartile 75% (IQ3) | 94.0% | 95.9% |
| Interquartile Range (IQR) | 4.1% | 4.9% |
| Standard Deviation (Sample) | 5.3% | 4.7% |
| Standard Deviation (Population) | 5.2% | 4.7% |
Similar Demographics by 1 or more Vehicles in Household
Demographics Similar to Immigrants from Kenya by 1 or more Vehicles in Household
In terms of 1 or more vehicles in household, the demographic groups most similar to Immigrants from Kenya are Nicaraguan (90.4%, a difference of 0.010%), Immigrants from South Africa (90.4%, a difference of 0.010%), Immigrants from the Azores (90.4%, a difference of 0.020%), Burmese (90.4%, a difference of 0.020%), and Marshallese (90.4%, a difference of 0.020%).
| Demographics | Rating | Rank | 1 or more Vehicles in Household |
| Puget Sound Salish | 91.5 /100 | #124 | Exceptional 90.5% |
| Immigrants | Korea | 90.5 /100 | #125 | Exceptional 90.5% |
| Immigrants | Cameroon | 89.4 /100 | #126 | Excellent 90.4% |
| Immigrants | Azores | 89.1 /100 | #127 | Excellent 90.4% |
| Burmese | 89.0 /100 | #128 | Excellent 90.4% |
| Marshallese | 88.9 /100 | #129 | Excellent 90.4% |
| Nicaraguans | 88.8 /100 | #130 | Excellent 90.4% |
| Immigrants | Kenya | 88.5 /100 | #131 | Excellent 90.4% |
| Immigrants | South Africa | 88.1 /100 | #132 | Excellent 90.4% |
| Immigrants | Syria | 87.5 /100 | #133 | Excellent 90.4% |
| Kenyans | 87.0 /100 | #134 | Excellent 90.4% |
| Immigrants | Oceania | 86.9 /100 | #135 | Excellent 90.4% |
| Hungarians | 86.5 /100 | #136 | Excellent 90.3% |
| Latvians | 86.3 /100 | #137 | Excellent 90.3% |
| Syrians | 86.3 /100 | #138 | Excellent 90.3% |
Demographics Similar to Immigrants from Central America by 1 or more Vehicles in Household
In terms of 1 or more vehicles in household, the demographic groups most similar to Immigrants from Central America are Bulgarian (91.1%, a difference of 0.010%), Seminole (91.1%, a difference of 0.030%), Immigrants from Bolivia (91.2%, a difference of 0.040%), Yugoslavian (91.1%, a difference of 0.040%), and Asian (91.1%, a difference of 0.050%).
| Demographics | Rating | Rank | 1 or more Vehicles in Household |
| Immigrants | North America | 99.2 /100 | #93 | Exceptional 91.4% |
| Immigrants | Cuba | 99.1 /100 | #94 | Exceptional 91.3% |
| Austrians | 99.0 /100 | #95 | Exceptional 91.3% |
| Potawatomi | 99.0 /100 | #96 | Exceptional 91.3% |
| Pakistanis | 99.0 /100 | #97 | Exceptional 91.3% |
| Slavs | 98.7 /100 | #98 | Exceptional 91.2% |
| Immigrants | Bolivia | 98.6 /100 | #99 | Exceptional 91.2% |
| Immigrants | Central America | 98.4 /100 | #100 | Exceptional 91.1% |
| Bulgarians | 98.4 /100 | #101 | Exceptional 91.1% |
| Seminole | 98.3 /100 | #102 | Exceptional 91.1% |
| Yugoslavians | 98.3 /100 | #103 | Exceptional 91.1% |
| Asians | 98.2 /100 | #104 | Exceptional 91.1% |
| Laotians | 98.0 /100 | #105 | Exceptional 91.0% |
| Zimbabweans | 97.7 /100 | #106 | Exceptional 91.0% |
| Maltese | 97.7 /100 | #107 | Exceptional 91.0% |