Immigrants from Kazakhstan vs Cherokee 4 or more Vehicles in Household
COMPARE
Immigrants from Kazakhstan
Cherokee
4 or more Vehicles in Household
4 or more Vehicles in Household Comparison
Immigrants from Kazakhstan
Cherokee
5.5%
4 OR MORE VEHICLES IN HOUSEHOLD
0.6/ 100
METRIC RATING
272nd/ 347
METRIC RANK
7.7%
4 OR MORE VEHICLES IN HOUSEHOLD
100.0/ 100
METRIC RATING
49th/ 347
METRIC RANK
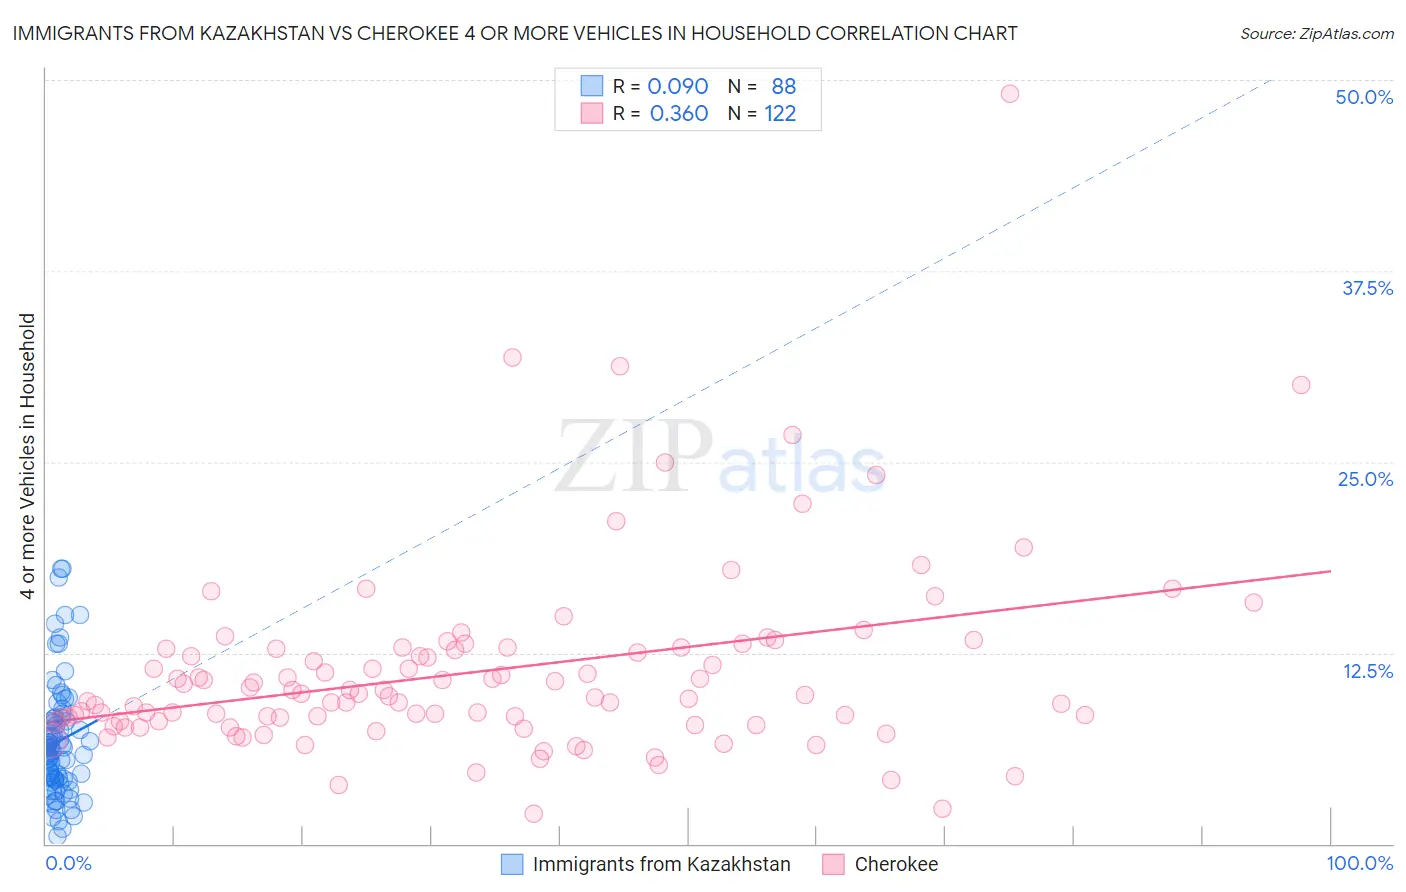
Immigrants from Kazakhstan vs Cherokee 4 or more Vehicles in Household Correlation Chart
The statistical analysis conducted on geographies consisting of 124,145,128 people shows a slight positive correlation between the proportion of Immigrants from Kazakhstan and percentage of households with 4 or more vehicles available in the United States with a correlation coefficient (R) of 0.090 and weighted average of 5.5%. Similarly, the statistical analysis conducted on geographies consisting of 491,792,764 people shows a mild positive correlation between the proportion of Cherokee and percentage of households with 4 or more vehicles available in the United States with a correlation coefficient (R) of 0.360 and weighted average of 7.7%, a difference of 40.6%.
4 or more Vehicles in Household Correlation Summary
| Measurement | Immigrants from Kazakhstan | Cherokee |
| Minimum | 0.50% | 1.9% |
| Maximum | 18.0% | 49.1% |
| Range | 17.5% | 47.2% |
| Mean | 6.7% | 11.3% |
| Median | 6.2% | 9.8% |
| Interquartile 25% (IQ1) | 4.3% | 8.0% |
| Interquartile 75% (IQ3) | 8.1% | 12.8% |
| Interquartile Range (IQR) | 3.8% | 4.7% |
| Standard Deviation (Sample) | 3.8% | 6.3% |
| Standard Deviation (Population) | 3.7% | 6.3% |
Similar Demographics by 4 or more Vehicles in Household
Demographics Similar to Immigrants from Kazakhstan by 4 or more Vehicles in Household
In terms of 4 or more vehicles in household, the demographic groups most similar to Immigrants from Kazakhstan are Macedonian (5.5%, a difference of 0.030%), Black/African American (5.5%, a difference of 0.15%), Immigrants from Sudan (5.5%, a difference of 0.19%), Cambodian (5.5%, a difference of 0.27%), and Immigrants from Latvia (5.5%, a difference of 0.28%).
| Demographics | Rating | Rank | 4 or more Vehicles in Household |
| South Americans | 0.9 /100 | #265 | Tragic 5.6% |
| Immigrants | Nepal | 0.9 /100 | #266 | Tragic 5.6% |
| Immigrants | Ukraine | 0.9 /100 | #267 | Tragic 5.6% |
| Colombians | 0.7 /100 | #268 | Tragic 5.5% |
| Carpatho Rusyns | 0.7 /100 | #269 | Tragic 5.5% |
| Okinawans | 0.6 /100 | #270 | Tragic 5.5% |
| Immigrants | Sudan | 0.6 /100 | #271 | Tragic 5.5% |
| Immigrants | Kazakhstan | 0.6 /100 | #272 | Tragic 5.5% |
| Macedonians | 0.6 /100 | #273 | Tragic 5.5% |
| Blacks/African Americans | 0.6 /100 | #274 | Tragic 5.5% |
| Cambodians | 0.5 /100 | #275 | Tragic 5.5% |
| Immigrants | Latvia | 0.5 /100 | #276 | Tragic 5.5% |
| Immigrants | Bulgaria | 0.5 /100 | #277 | Tragic 5.5% |
| Immigrants | Eastern Europe | 0.4 /100 | #278 | Tragic 5.4% |
| Immigrants | Uruguay | 0.3 /100 | #279 | Tragic 5.4% |
Demographics Similar to Cherokee by 4 or more Vehicles in Household
In terms of 4 or more vehicles in household, the demographic groups most similar to Cherokee are Immigrants from El Salvador (7.7%, a difference of 0.16%), Swiss (7.8%, a difference of 0.19%), Osage (7.8%, a difference of 0.36%), Immigrants from Laos (7.7%, a difference of 0.51%), and Crow (7.8%, a difference of 0.52%).
| Demographics | Rating | Rank | 4 or more Vehicles in Household |
| Salvadorans | 100.0 /100 | #42 | Exceptional 7.8% |
| Fijians | 100.0 /100 | #43 | Exceptional 7.8% |
| Bhutanese | 100.0 /100 | #44 | Exceptional 7.8% |
| Choctaw | 100.0 /100 | #45 | Exceptional 7.8% |
| Crow | 100.0 /100 | #46 | Exceptional 7.8% |
| Osage | 100.0 /100 | #47 | Exceptional 7.8% |
| Swiss | 100.0 /100 | #48 | Exceptional 7.8% |
| Cherokee | 100.0 /100 | #49 | Exceptional 7.7% |
| Immigrants | El Salvador | 100.0 /100 | #50 | Exceptional 7.7% |
| Immigrants | Laos | 100.0 /100 | #51 | Exceptional 7.7% |
| Japanese | 100.0 /100 | #52 | Exceptional 7.7% |
| Malaysians | 100.0 /100 | #53 | Exceptional 7.7% |
| Dutch | 100.0 /100 | #54 | Exceptional 7.7% |
| Immigrants | Oceania | 100.0 /100 | #55 | Exceptional 7.6% |
| English | 100.0 /100 | #56 | Exceptional 7.6% |