Immigrants from Israel vs Yuman Associate's Degree
COMPARE
Immigrants from Israel
Yuman
Associate's Degree
Associate's Degree Comparison
Immigrants from Israel
Yuman
56.8%
ASSOCIATE'S DEGREE
100.0/ 100
METRIC RATING
9th/ 347
METRIC RANK
31.3%
ASSOCIATE'S DEGREE
0.0/ 100
METRIC RATING
344th/ 347
METRIC RANK
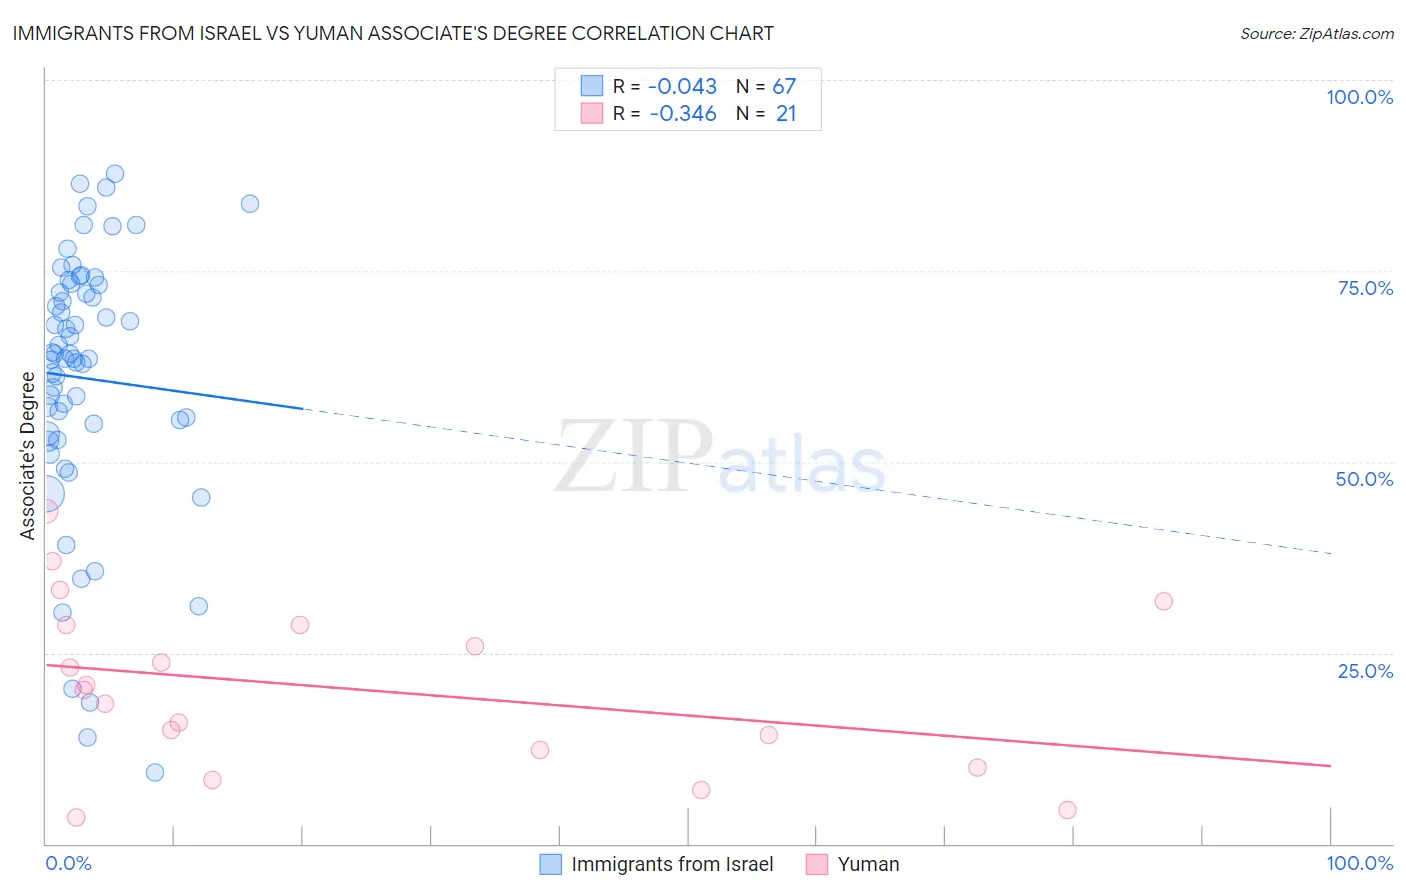
Immigrants from Israel vs Yuman Associate's Degree Correlation Chart
The statistical analysis conducted on geographies consisting of 210,027,202 people shows no correlation between the proportion of Immigrants from Israel and percentage of population with at least associate's degree education in the United States with a correlation coefficient (R) of -0.043 and weighted average of 56.8%. Similarly, the statistical analysis conducted on geographies consisting of 40,695,957 people shows a mild negative correlation between the proportion of Yuman and percentage of population with at least associate's degree education in the United States with a correlation coefficient (R) of -0.346 and weighted average of 31.3%, a difference of 81.7%.
Associate's Degree Correlation Summary
| Measurement | Immigrants from Israel | Yuman |
| Minimum | 9.3% | 3.5% |
| Maximum | 87.7% | 43.6% |
| Range | 78.4% | 40.1% |
| Mean | 61.0% | 20.3% |
| Median | 63.5% | 20.2% |
| Interquartile 25% (IQ1) | 53.7% | 11.1% |
| Interquartile 75% (IQ3) | 73.2% | 28.7% |
| Interquartile Range (IQR) | 19.5% | 17.6% |
| Standard Deviation (Sample) | 17.4% | 11.0% |
| Standard Deviation (Population) | 17.3% | 10.8% |
Similar Demographics by Associate's Degree
Demographics Similar to Immigrants from Israel by Associate's Degree
In terms of associate's degree, the demographic groups most similar to Immigrants from Israel are Cypriot (56.4%, a difference of 0.72%), Thai (57.4%, a difference of 1.1%), Immigrants from Iran (57.7%, a difference of 1.5%), Okinawan (57.7%, a difference of 1.6%), and Immigrants from Australia (55.8%, a difference of 1.8%).
| Demographics | Rating | Rank | Associate's Degree |
| Immigrants | Singapore | 100.0 /100 | #2 | Exceptional 58.9% |
| Immigrants | India | 100.0 /100 | #3 | Exceptional 58.5% |
| Immigrants | Taiwan | 100.0 /100 | #4 | Exceptional 58.4% |
| Iranians | 100.0 /100 | #5 | Exceptional 58.2% |
| Okinawans | 100.0 /100 | #6 | Exceptional 57.7% |
| Immigrants | Iran | 100.0 /100 | #7 | Exceptional 57.7% |
| Thais | 100.0 /100 | #8 | Exceptional 57.4% |
| Immigrants | Israel | 100.0 /100 | #9 | Exceptional 56.8% |
| Cypriots | 100.0 /100 | #10 | Exceptional 56.4% |
| Immigrants | Australia | 100.0 /100 | #11 | Exceptional 55.8% |
| Immigrants | South Central Asia | 100.0 /100 | #12 | Exceptional 55.7% |
| Immigrants | China | 100.0 /100 | #13 | Exceptional 55.5% |
| Immigrants | Hong Kong | 100.0 /100 | #14 | Exceptional 55.4% |
| Immigrants | Eastern Asia | 100.0 /100 | #15 | Exceptional 55.4% |
| Soviet Union | 100.0 /100 | #16 | Exceptional 55.1% |
Demographics Similar to Yuman by Associate's Degree
In terms of associate's degree, the demographic groups most similar to Yuman are Tohono O'odham (31.8%, a difference of 1.7%), Yakama (32.3%, a difference of 3.4%), Pima (30.2%, a difference of 3.4%), Inupiat (32.6%, a difference of 4.2%), and Navajo (32.6%, a difference of 4.3%).
| Demographics | Rating | Rank | Associate's Degree |
| Mexicans | 0.0 /100 | #333 | Tragic 35.0% |
| Natives/Alaskans | 0.0 /100 | #334 | Tragic 34.9% |
| Spanish American Indians | 0.0 /100 | #335 | Tragic 34.9% |
| Hopi | 0.0 /100 | #336 | Tragic 34.6% |
| Lumbee | 0.0 /100 | #337 | Tragic 34.1% |
| Pueblo | 0.0 /100 | #338 | Tragic 34.0% |
| Immigrants | Mexico | 0.0 /100 | #339 | Tragic 33.7% |
| Navajo | 0.0 /100 | #340 | Tragic 32.6% |
| Inupiat | 0.0 /100 | #341 | Tragic 32.6% |
| Yakama | 0.0 /100 | #342 | Tragic 32.3% |
| Tohono O'odham | 0.0 /100 | #343 | Tragic 31.8% |
| Yuman | 0.0 /100 | #344 | Tragic 31.3% |
| Pima | 0.0 /100 | #345 | Tragic 30.2% |
| Houma | 0.0 /100 | #346 | Tragic 28.2% |
| Yup'ik | 0.0 /100 | #347 | Tragic 25.0% |