Immigrants from Israel vs Israeli 1 or more Vehicles in Household
COMPARE
Immigrants from Israel
Israeli
1 or more Vehicles in Household
1 or more Vehicles in Household Comparison
Immigrants from Israel
Israelis
84.5%
1 OR MORE VEHICLES IN HOUSEHOLD
0.0/ 100
METRIC RATING
313th/ 347
METRIC RANK
87.7%
1 OR MORE VEHICLES IN HOUSEHOLD
0.3/ 100
METRIC RATING
266th/ 347
METRIC RANK
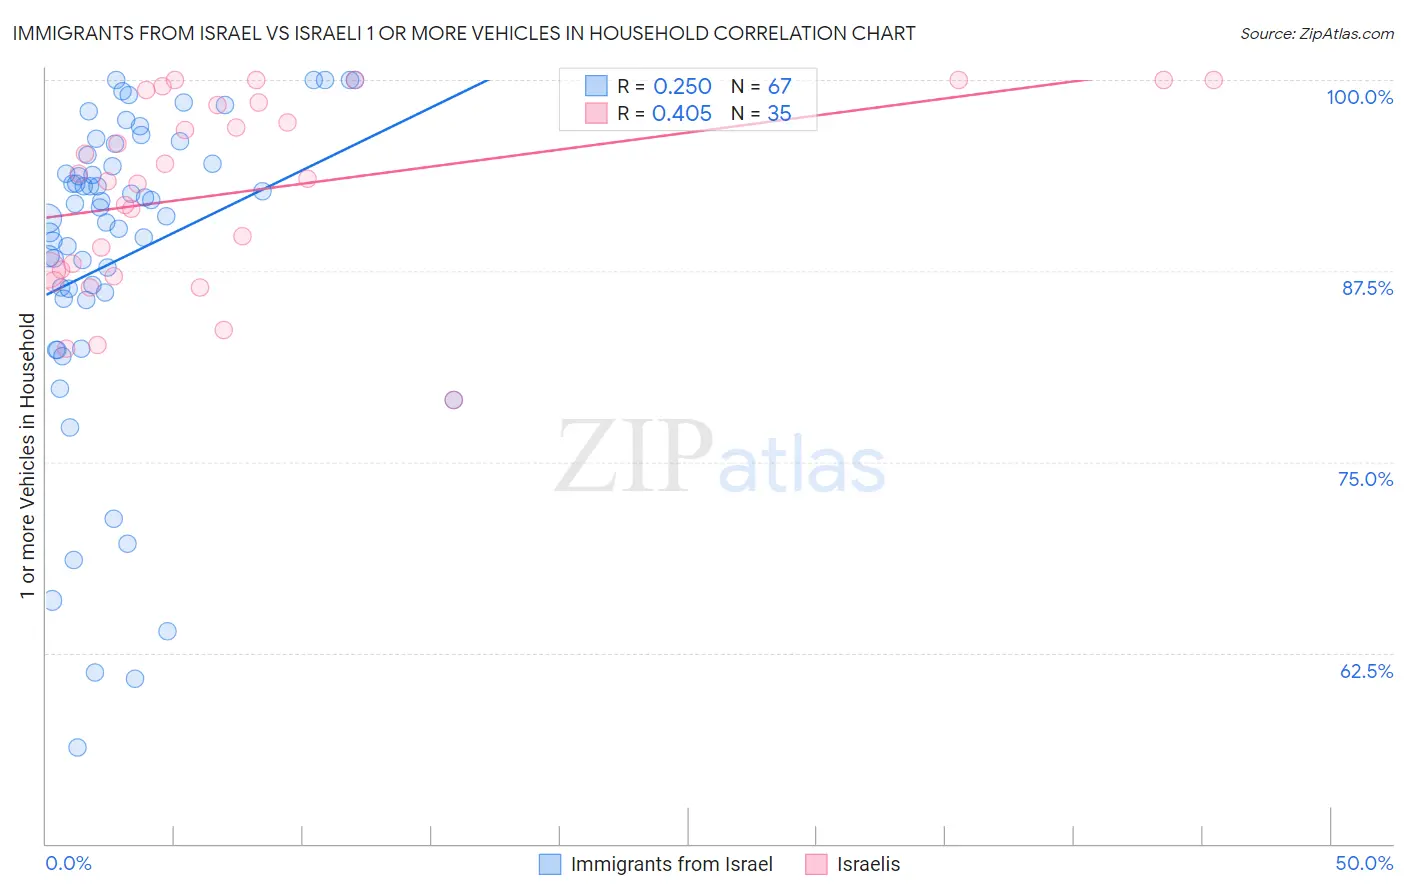
Immigrants from Israel vs Israeli 1 or more Vehicles in Household Correlation Chart
The statistical analysis conducted on geographies consisting of 209,984,574 people shows a weak positive correlation between the proportion of Immigrants from Israel and percentage of households with 1 or more vehicles available in the United States with a correlation coefficient (R) of 0.250 and weighted average of 84.5%. Similarly, the statistical analysis conducted on geographies consisting of 211,015,607 people shows a moderate positive correlation between the proportion of Israelis and percentage of households with 1 or more vehicles available in the United States with a correlation coefficient (R) of 0.405 and weighted average of 87.7%, a difference of 3.7%.
1 or more Vehicles in Household Correlation Summary
| Measurement | Immigrants from Israel | Israeli |
| Minimum | 56.3% | 79.1% |
| Maximum | 100.0% | 100.0% |
| Range | 43.7% | 20.9% |
| Mean | 88.4% | 92.7% |
| Median | 91.7% | 93.5% |
| Interquartile 25% (IQ1) | 85.7% | 87.6% |
| Interquartile 75% (IQ3) | 95.1% | 98.5% |
| Interquartile Range (IQR) | 9.4% | 11.0% |
| Standard Deviation (Sample) | 10.4% | 6.1% |
| Standard Deviation (Population) | 10.3% | 6.0% |
Similar Demographics by 1 or more Vehicles in Household
Demographics Similar to Immigrants from Israel by 1 or more Vehicles in Household
In terms of 1 or more vehicles in household, the demographic groups most similar to Immigrants from Israel are Cape Verdean (84.5%, a difference of 0.020%), Albanian (84.4%, a difference of 0.070%), Puerto Rican (84.6%, a difference of 0.13%), Cypriot (84.4%, a difference of 0.13%), and U.S. Virgin Islander (84.6%, a difference of 0.17%).
| Demographics | Rating | Rank | 1 or more Vehicles in Household |
| Immigrants | Western Africa | 0.0 /100 | #306 | Tragic 84.9% |
| Tohono O'odham | 0.0 /100 | #307 | Tragic 84.7% |
| Immigrants | Belize | 0.0 /100 | #308 | Tragic 84.7% |
| Immigrants | Haiti | 0.0 /100 | #309 | Tragic 84.7% |
| U.S. Virgin Islanders | 0.0 /100 | #310 | Tragic 84.6% |
| Puerto Ricans | 0.0 /100 | #311 | Tragic 84.6% |
| Cape Verdeans | 0.0 /100 | #312 | Tragic 84.5% |
| Immigrants | Israel | 0.0 /100 | #313 | Tragic 84.5% |
| Albanians | 0.0 /100 | #314 | Tragic 84.4% |
| Cypriots | 0.0 /100 | #315 | Tragic 84.4% |
| Alaska Natives | 0.0 /100 | #316 | Tragic 83.8% |
| Ghanaians | 0.0 /100 | #317 | Tragic 83.6% |
| Immigrants | Ghana | 0.0 /100 | #318 | Tragic 83.4% |
| Immigrants | Belarus | 0.0 /100 | #319 | Tragic 83.3% |
| Soviet Union | 0.0 /100 | #320 | Tragic 82.7% |
Demographics Similar to Israelis by 1 or more Vehicles in Household
In terms of 1 or more vehicles in household, the demographic groups most similar to Israelis are Immigrants from Colombia (87.6%, a difference of 0.030%), Immigrants from Europe (87.6%, a difference of 0.070%), Immigrants from Africa (87.6%, a difference of 0.12%), Panamanian (87.5%, a difference of 0.13%), and Bermudan (87.5%, a difference of 0.13%).
| Demographics | Rating | Rank | 1 or more Vehicles in Household |
| Nigerians | 0.8 /100 | #259 | Tragic 88.0% |
| Macedonians | 0.6 /100 | #260 | Tragic 87.9% |
| Immigrants | Switzerland | 0.6 /100 | #261 | Tragic 87.9% |
| Sub-Saharan Africans | 0.5 /100 | #262 | Tragic 87.9% |
| Immigrants | Egypt | 0.5 /100 | #263 | Tragic 87.8% |
| Immigrants | Liberia | 0.4 /100 | #264 | Tragic 87.8% |
| Africans | 0.4 /100 | #265 | Tragic 87.8% |
| Israelis | 0.3 /100 | #266 | Tragic 87.7% |
| Immigrants | Colombia | 0.3 /100 | #267 | Tragic 87.6% |
| Immigrants | Europe | 0.2 /100 | #268 | Tragic 87.6% |
| Immigrants | Africa | 0.2 /100 | #269 | Tragic 87.6% |
| Panamanians | 0.2 /100 | #270 | Tragic 87.5% |
| Bermudans | 0.2 /100 | #271 | Tragic 87.5% |
| Aleuts | 0.2 /100 | #272 | Tragic 87.5% |
| Immigrants | Northern Africa | 0.2 /100 | #273 | Tragic 87.4% |