Immigrants from Israel vs Iranian Single Mother Households
COMPARE
Immigrants from Israel
Iranian
Single Mother Households
Single Mother Households Comparison
Immigrants from Israel
Iranians
5.0%
SINGLE MOTHER HOUSEHOLDS
99.9/ 100
METRIC RATING
10th/ 347
METRIC RANK
5.0%
SINGLE MOTHER HOUSEHOLDS
100.0/ 100
METRIC RATING
7th/ 347
METRIC RANK
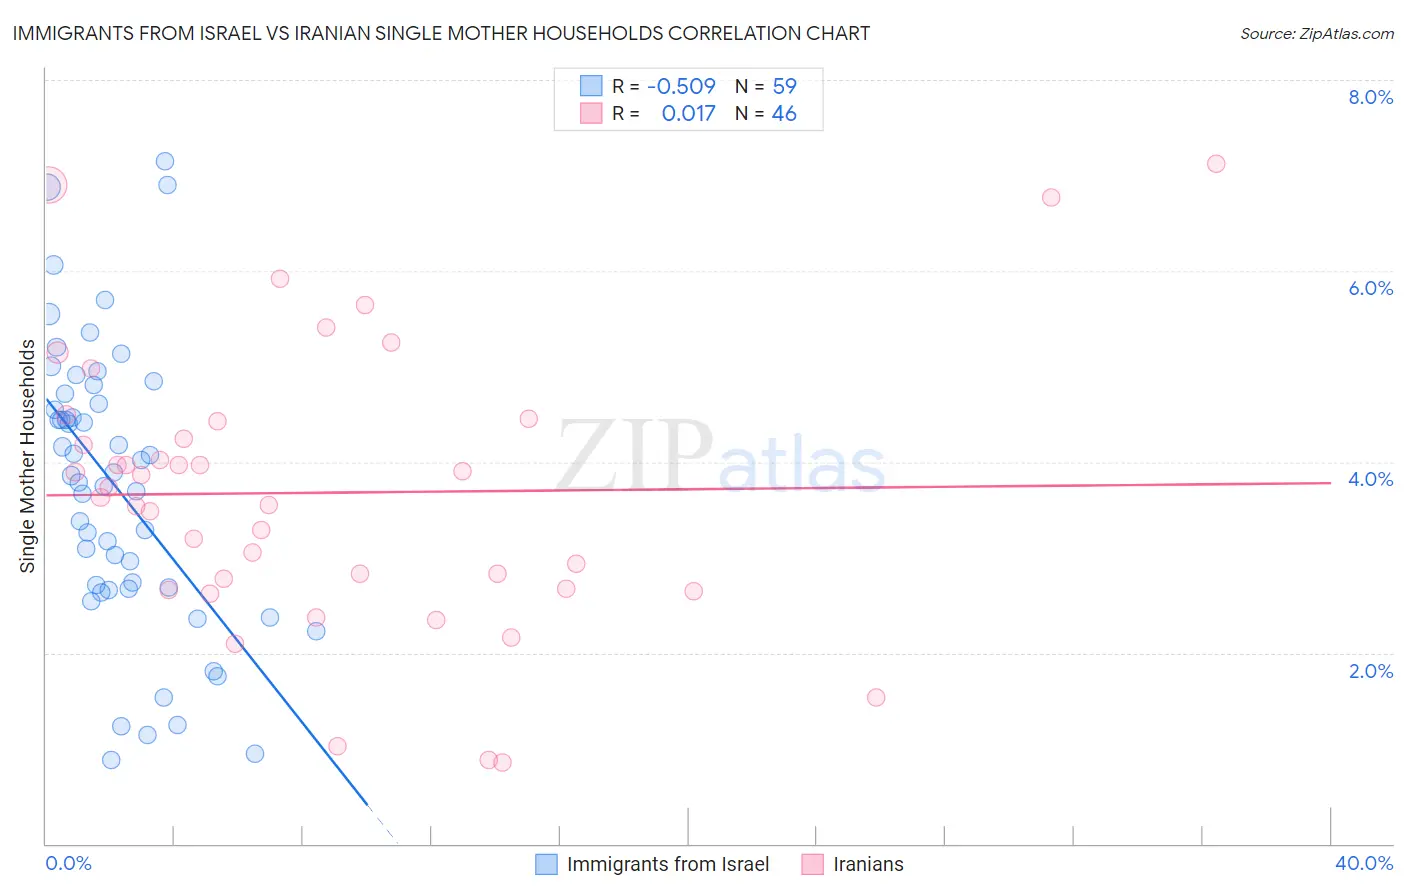
Immigrants from Israel vs Iranian Single Mother Households Correlation Chart
The statistical analysis conducted on geographies consisting of 209,589,874 people shows a substantial negative correlation between the proportion of Immigrants from Israel and percentage of single mother households in the United States with a correlation coefficient (R) of -0.509 and weighted average of 5.0%. Similarly, the statistical analysis conducted on geographies consisting of 316,158,075 people shows no correlation between the proportion of Iranians and percentage of single mother households in the United States with a correlation coefficient (R) of 0.017 and weighted average of 5.0%, a difference of 1.1%.
Single Mother Households Correlation Summary
| Measurement | Immigrants from Israel | Iranian |
| Minimum | 0.87% | 0.85% |
| Maximum | 7.1% | 7.1% |
| Range | 6.3% | 6.3% |
| Mean | 3.7% | 3.7% |
| Median | 3.9% | 3.7% |
| Interquartile 25% (IQ1) | 2.7% | 2.7% |
| Interquartile 75% (IQ3) | 4.7% | 4.4% |
| Interquartile Range (IQR) | 2.0% | 1.8% |
| Standard Deviation (Sample) | 1.5% | 1.5% |
| Standard Deviation (Population) | 1.5% | 1.5% |
Demographics Similar to Immigrants from Israel and Iranians by Single Mother Households
In terms of single mother households, the demographic groups most similar to Immigrants from Israel are Okinawan (5.0%, a difference of 0.34%), Immigrants from Ireland (5.0%, a difference of 0.49%), Immigrants from China (5.1%, a difference of 0.63%), Cypriot (5.1%, a difference of 0.81%), and Immigrants from India (5.1%, a difference of 0.94%). Similarly, the demographic groups most similar to Iranians are Immigrants from Singapore (5.0%, a difference of 0.25%), Immigrants from Ireland (5.0%, a difference of 0.66%), Okinawan (5.0%, a difference of 0.81%), Immigrants from China (5.1%, a difference of 1.8%), and Cypriot (5.1%, a difference of 2.0%).
| Demographics | Rating | Rank | Single Mother Households |
| Immigrants | Taiwan | 100.0 /100 | #1 | Exceptional 4.7% |
| Filipinos | 100.0 /100 | #2 | Exceptional 4.7% |
| Immigrants | Iran | 100.0 /100 | #3 | Exceptional 4.8% |
| Assyrians/Chaldeans/Syriacs | 100.0 /100 | #4 | Exceptional 4.8% |
| Immigrants | Hong Kong | 100.0 /100 | #5 | Exceptional 4.8% |
| Immigrants | Singapore | 100.0 /100 | #6 | Exceptional 5.0% |
| Iranians | 100.0 /100 | #7 | Exceptional 5.0% |
| Immigrants | Ireland | 99.9 /100 | #8 | Exceptional 5.0% |
| Okinawans | 99.9 /100 | #9 | Exceptional 5.0% |
| Immigrants | Israel | 99.9 /100 | #10 | Exceptional 5.0% |
| Immigrants | China | 99.9 /100 | #11 | Exceptional 5.1% |
| Cypriots | 99.9 /100 | #12 | Exceptional 5.1% |
| Immigrants | India | 99.9 /100 | #13 | Exceptional 5.1% |
| Immigrants | Australia | 99.9 /100 | #14 | Exceptional 5.1% |
| Immigrants | Eastern Asia | 99.9 /100 | #15 | Exceptional 5.1% |
| Indians (Asian) | 99.9 /100 | #16 | Exceptional 5.1% |
| Soviet Union | 99.9 /100 | #17 | Exceptional 5.1% |
| Immigrants | Armenia | 99.9 /100 | #18 | Exceptional 5.2% |
| Chinese | 99.9 /100 | #19 | Exceptional 5.2% |
| Maltese | 99.9 /100 | #20 | Exceptional 5.2% |