Immigrants vs Alaska Native 4 or more Vehicles in Household
COMPARE
Immigrants
Alaska Native
4 or more Vehicles in Household
4 or more Vehicles in Household Comparison
Immigrants
Alaska Natives
6.8%
4 OR MORE VEHICLES IN HOUSEHOLD
94.6/ 100
METRIC RATING
123rd/ 347
METRIC RANK
7.3%
4 OR MORE VEHICLES IN HOUSEHOLD
99.8/ 100
METRIC RATING
80th/ 347
METRIC RANK
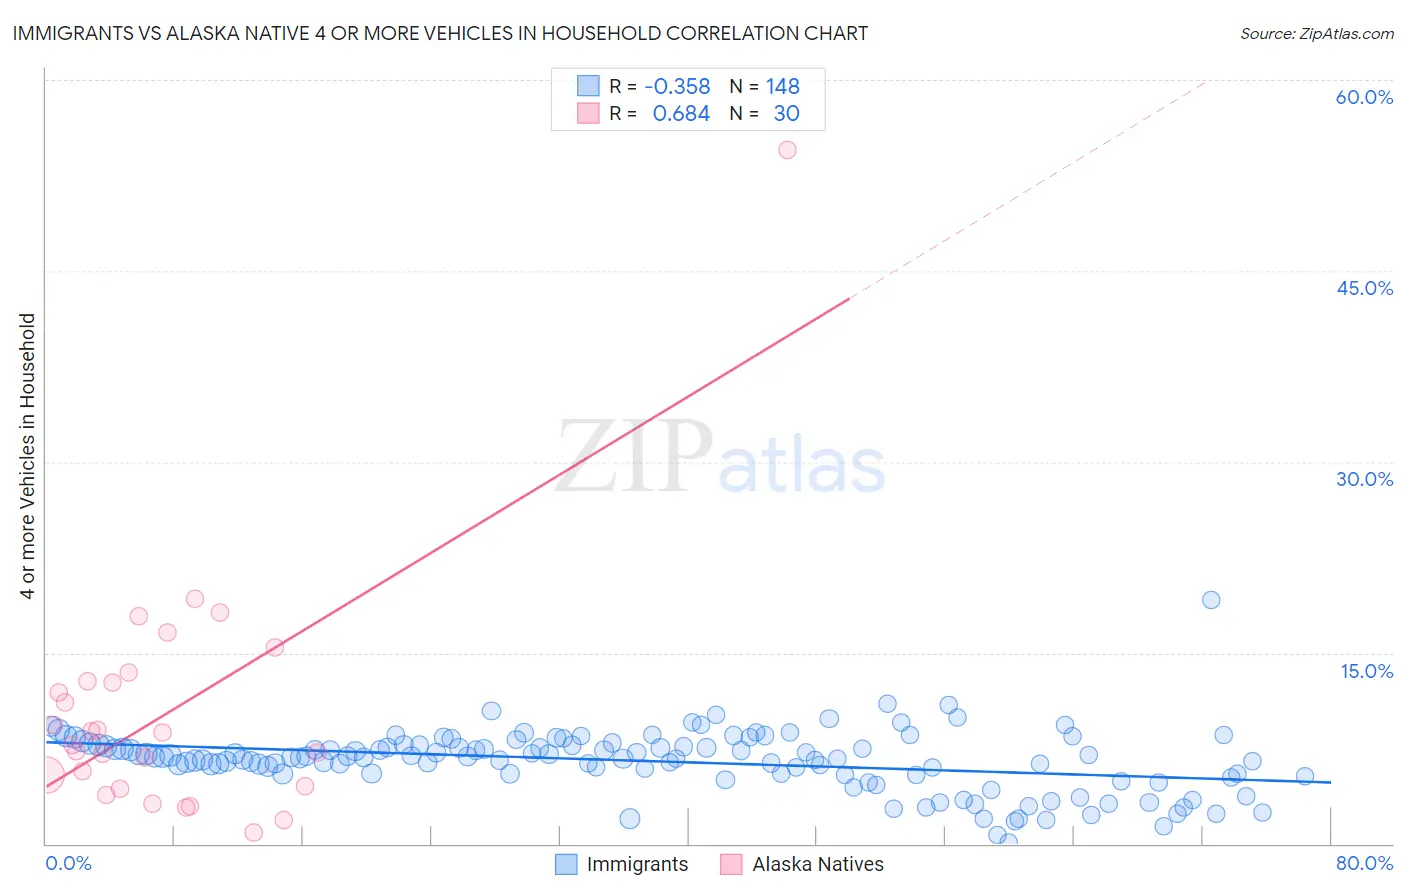
Immigrants vs Alaska Native 4 or more Vehicles in Household Correlation Chart
The statistical analysis conducted on geographies consisting of 573,807,662 people shows a mild negative correlation between the proportion of Immigrants and percentage of households with 4 or more vehicles available in the United States with a correlation coefficient (R) of -0.358 and weighted average of 6.8%. Similarly, the statistical analysis conducted on geographies consisting of 76,511,900 people shows a significant positive correlation between the proportion of Alaska Natives and percentage of households with 4 or more vehicles available in the United States with a correlation coefficient (R) of 0.684 and weighted average of 7.3%, a difference of 8.2%.
4 or more Vehicles in Household Correlation Summary
| Measurement | Immigrants | Alaska Native |
| Minimum | 0.13% | 0.90% |
| Maximum | 19.1% | 54.5% |
| Range | 19.0% | 53.6% |
| Mean | 6.5% | 10.4% |
| Median | 6.8% | 8.3% |
| Interquartile 25% (IQ1) | 5.5% | 4.5% |
| Interquartile 75% (IQ3) | 7.8% | 12.7% |
| Interquartile Range (IQR) | 2.3% | 8.2% |
| Standard Deviation (Sample) | 2.4% | 9.8% |
| Standard Deviation (Population) | 2.4% | 9.6% |
Similar Demographics by 4 or more Vehicles in Household
Demographics Similar to Immigrants by 4 or more Vehicles in Household
In terms of 4 or more vehicles in household, the demographic groups most similar to Immigrants are Immigrants from Nicaragua (6.8%, a difference of 0.060%), Immigrants from Germany (6.8%, a difference of 0.070%), Immigrants from Asia (6.8%, a difference of 0.10%), Comanche (6.8%, a difference of 0.13%), and Austrian (6.8%, a difference of 0.19%).
| Demographics | Rating | Rank | 4 or more Vehicles in Household |
| Immigrants | Guatemala | 95.8 /100 | #116 | Exceptional 6.8% |
| Burmese | 95.7 /100 | #117 | Exceptional 6.8% |
| French American Indians | 95.7 /100 | #118 | Exceptional 6.8% |
| Costa Ricans | 95.5 /100 | #119 | Exceptional 6.8% |
| Comanche | 94.8 /100 | #120 | Exceptional 6.8% |
| Immigrants | Germany | 94.7 /100 | #121 | Exceptional 6.8% |
| Immigrants | Nicaragua | 94.7 /100 | #122 | Exceptional 6.8% |
| Immigrants | Immigrants | 94.6 /100 | #123 | Exceptional 6.8% |
| Immigrants | Asia | 94.4 /100 | #124 | Exceptional 6.8% |
| Austrians | 94.1 /100 | #125 | Exceptional 6.8% |
| Belgians | 94.1 /100 | #126 | Exceptional 6.8% |
| Immigrants | Korea | 93.8 /100 | #127 | Exceptional 6.8% |
| Immigrants | Bolivia | 92.5 /100 | #128 | Exceptional 6.7% |
| Immigrants | England | 92.0 /100 | #129 | Exceptional 6.7% |
| Immigrants | Scotland | 89.0 /100 | #130 | Excellent 6.7% |
Demographics Similar to Alaska Natives by 4 or more Vehicles in Household
In terms of 4 or more vehicles in household, the demographic groups most similar to Alaska Natives are Czech (7.4%, a difference of 0.14%), White/Caucasian (7.4%, a difference of 0.31%), Apache (7.4%, a difference of 0.38%), Laotian (7.4%, a difference of 0.54%), and Finnish (7.3%, a difference of 0.56%).
| Demographics | Rating | Rank | 4 or more Vehicles in Household |
| Portuguese | 99.9 /100 | #73 | Exceptional 7.4% |
| Icelanders | 99.9 /100 | #74 | Exceptional 7.4% |
| Immigrants | Cambodia | 99.9 /100 | #75 | Exceptional 7.4% |
| Laotians | 99.9 /100 | #76 | Exceptional 7.4% |
| Apache | 99.9 /100 | #77 | Exceptional 7.4% |
| Whites/Caucasians | 99.8 /100 | #78 | Exceptional 7.4% |
| Czechs | 99.8 /100 | #79 | Exceptional 7.4% |
| Alaska Natives | 99.8 /100 | #80 | Exceptional 7.3% |
| Finns | 99.8 /100 | #81 | Exceptional 7.3% |
| Northern Europeans | 99.8 /100 | #82 | Exceptional 7.3% |
| Potawatomi | 99.7 /100 | #83 | Exceptional 7.3% |
| Afghans | 99.7 /100 | #84 | Exceptional 7.3% |
| Cree | 99.7 /100 | #85 | Exceptional 7.2% |
| Immigrants | Indonesia | 99.6 /100 | #86 | Exceptional 7.2% |
| Delaware | 99.6 /100 | #87 | Exceptional 7.2% |