Immigrants from Barbados vs South American Indian 2 or more Vehicles in Household
COMPARE
Immigrants from Barbados
South American Indian
2 or more Vehicles in Household
2 or more Vehicles in Household Comparison
Immigrants from Barbados
South American Indians
35.8%
2 OR MORE VEHICLES IN HOUSEHOLD
0.0/ 100
METRIC RATING
339th/ 347
METRIC RANK
53.9%
2 OR MORE VEHICLES IN HOUSEHOLD
6.5/ 100
METRIC RATING
219th/ 347
METRIC RANK
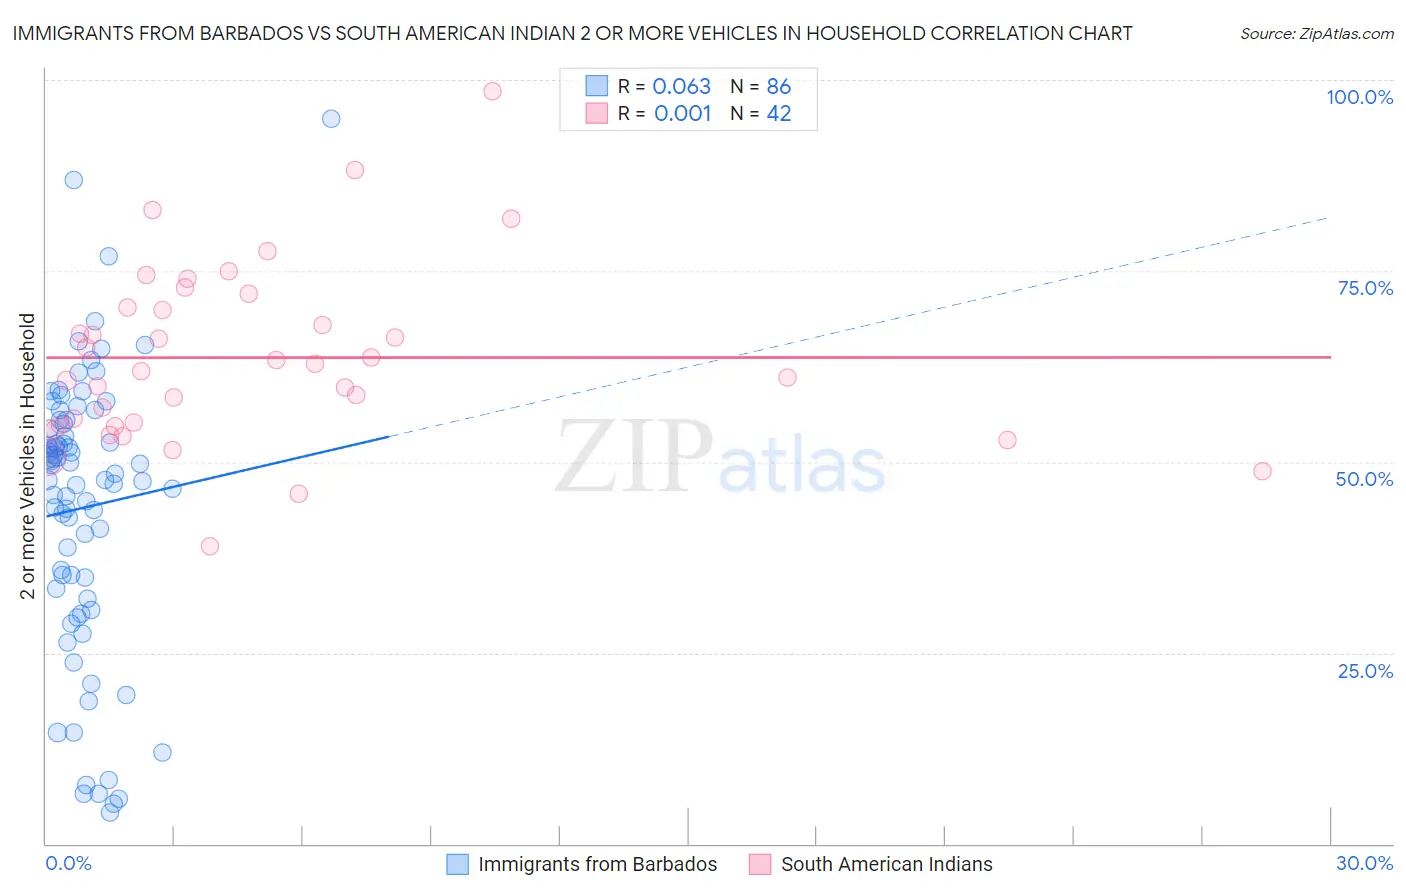
Immigrants from Barbados vs South American Indian 2 or more Vehicles in Household Correlation Chart
The statistical analysis conducted on geographies consisting of 112,774,153 people shows a slight positive correlation between the proportion of Immigrants from Barbados and percentage of households with 2 or more vehicles available in the United States with a correlation coefficient (R) of 0.063 and weighted average of 35.8%. Similarly, the statistical analysis conducted on geographies consisting of 164,540,449 people shows no correlation between the proportion of South American Indians and percentage of households with 2 or more vehicles available in the United States with a correlation coefficient (R) of 0.001 and weighted average of 53.9%, a difference of 50.6%.
2 or more Vehicles in Household Correlation Summary
| Measurement | Immigrants from Barbados | South American Indian |
| Minimum | 4.2% | 38.9% |
| Maximum | 94.9% | 98.5% |
| Range | 90.7% | 59.6% |
| Mean | 44.0% | 63.7% |
| Median | 48.0% | 62.4% |
| Interquartile 25% (IQ1) | 33.4% | 54.8% |
| Interquartile 75% (IQ3) | 55.1% | 70.2% |
| Interquartile Range (IQR) | 21.6% | 15.4% |
| Standard Deviation (Sample) | 18.4% | 11.8% |
| Standard Deviation (Population) | 18.3% | 11.6% |
Similar Demographics by 2 or more Vehicles in Household
Demographics Similar to Immigrants from Barbados by 2 or more Vehicles in Household
In terms of 2 or more vehicles in household, the demographic groups most similar to Immigrants from Barbados are British West Indian (35.4%, a difference of 1.1%), Guyanese (35.4%, a difference of 1.1%), Dominican (35.3%, a difference of 1.3%), Immigrants from Guyana (35.0%, a difference of 2.2%), and Yup'ik (34.9%, a difference of 2.4%).
| Demographics | Rating | Rank | 2 or more Vehicles in Household |
| Trinidadians and Tobagonians | 0.0 /100 | #332 | Tragic 40.9% |
| Immigrants | Ecuador | 0.0 /100 | #333 | Tragic 40.5% |
| Immigrants | Trinidad and Tobago | 0.0 /100 | #334 | Tragic 40.3% |
| Immigrants | Bangladesh | 0.0 /100 | #335 | Tragic 38.8% |
| Vietnamese | 0.0 /100 | #336 | Tragic 38.5% |
| Barbadians | 0.0 /100 | #337 | Tragic 38.3% |
| Immigrants | Uzbekistan | 0.0 /100 | #338 | Tragic 37.9% |
| Immigrants | Barbados | 0.0 /100 | #339 | Tragic 35.8% |
| British West Indians | 0.0 /100 | #340 | Tragic 35.4% |
| Guyanese | 0.0 /100 | #341 | Tragic 35.4% |
| Dominicans | 0.0 /100 | #342 | Tragic 35.3% |
| Immigrants | Guyana | 0.0 /100 | #343 | Tragic 35.0% |
| Yup'ik | 0.0 /100 | #344 | Tragic 34.9% |
| Immigrants | Dominican Republic | 0.0 /100 | #345 | Tragic 33.2% |
| Immigrants | St. Vincent and the Grenadines | 0.0 /100 | #346 | Tragic 31.0% |
Demographics Similar to South American Indians by 2 or more Vehicles in Household
In terms of 2 or more vehicles in household, the demographic groups most similar to South American Indians are Taiwanese (53.9%, a difference of 0.020%), Immigrants from Singapore (53.9%, a difference of 0.040%), Kiowa (53.9%, a difference of 0.050%), Immigrants from Argentina (53.9%, a difference of 0.060%), and Immigrants from Burma/Myanmar (53.9%, a difference of 0.11%).
| Demographics | Rating | Rank | 2 or more Vehicles in Household |
| Immigrants | Chile | 11.1 /100 | #212 | Poor 54.2% |
| Guatemalans | 9.6 /100 | #213 | Tragic 54.1% |
| Immigrants | Czechoslovakia | 9.4 /100 | #214 | Tragic 54.1% |
| Aleuts | 9.3 /100 | #215 | Tragic 54.1% |
| Immigrants | Western Asia | 9.3 /100 | #216 | Tragic 54.1% |
| Immigrants | Burma/Myanmar | 7.1 /100 | #217 | Tragic 53.9% |
| Immigrants | Argentina | 6.8 /100 | #218 | Tragic 53.9% |
| South American Indians | 6.5 /100 | #219 | Tragic 53.9% |
| Taiwanese | 6.3 /100 | #220 | Tragic 53.9% |
| Immigrants | Singapore | 6.3 /100 | #221 | Tragic 53.9% |
| Kiowa | 6.2 /100 | #222 | Tragic 53.9% |
| Immigrants | Bosnia and Herzegovina | 5.5 /100 | #223 | Tragic 53.8% |
| Brazilians | 5.3 /100 | #224 | Tragic 53.8% |
| Immigrants | Egypt | 5.2 /100 | #225 | Tragic 53.8% |
| Immigrants | Eastern Africa | 5.1 /100 | #226 | Tragic 53.7% |