Immigrants from Hong Kong vs Creek Married-couple Households
COMPARE
Immigrants from Hong Kong
Creek
Married-couple Households
Married-couple Households Comparison
Immigrants from Hong Kong
Creek
49.6%
MARRIED-COUPLE HOUSEHOLDS
99.9/ 100
METRIC RATING
17th/ 347
METRIC RANK
45.3%
MARRIED-COUPLE HOUSEHOLDS
6.4/ 100
METRIC RATING
212th/ 347
METRIC RANK
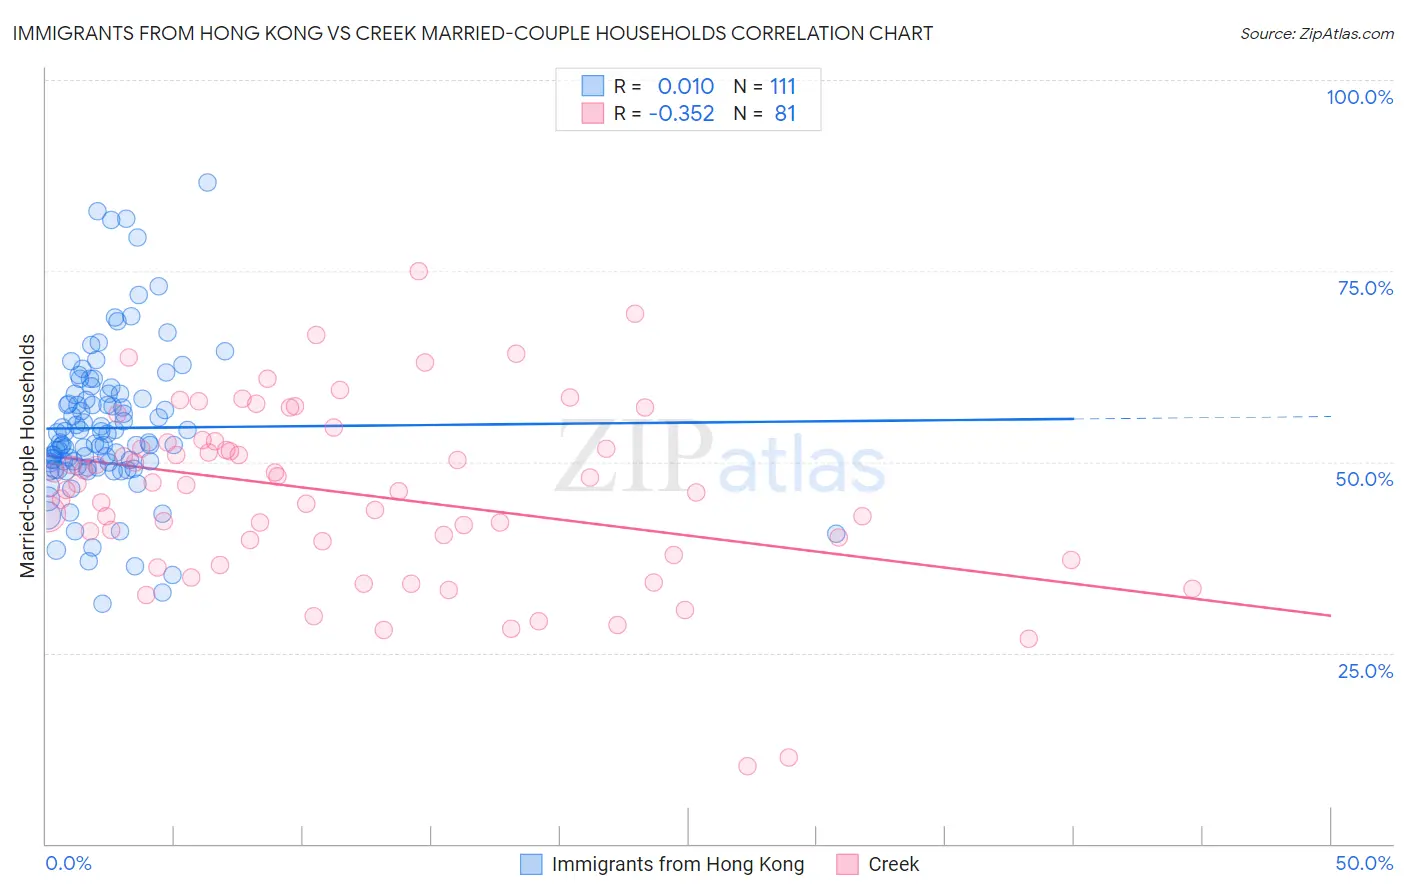
Immigrants from Hong Kong vs Creek Married-couple Households Correlation Chart
The statistical analysis conducted on geographies consisting of 253,895,593 people shows no correlation between the proportion of Immigrants from Hong Kong and percentage of married-couple family households in the United States with a correlation coefficient (R) of 0.010 and weighted average of 49.6%. Similarly, the statistical analysis conducted on geographies consisting of 178,433,601 people shows a mild negative correlation between the proportion of Creek and percentage of married-couple family households in the United States with a correlation coefficient (R) of -0.352 and weighted average of 45.3%, a difference of 9.6%.
Married-couple Households Correlation Summary
| Measurement | Immigrants from Hong Kong | Creek |
| Minimum | 31.4% | 10.1% |
| Maximum | 86.6% | 75.0% |
| Range | 55.2% | 64.9% |
| Mean | 54.4% | 45.8% |
| Median | 52.5% | 47.0% |
| Interquartile 25% (IQ1) | 49.3% | 38.8% |
| Interquartile 75% (IQ3) | 58.8% | 52.6% |
| Interquartile Range (IQR) | 9.5% | 13.9% |
| Standard Deviation (Sample) | 9.9% | 11.8% |
| Standard Deviation (Population) | 9.9% | 11.7% |
Similar Demographics by Married-couple Households
Demographics Similar to Immigrants from Hong Kong by Married-couple Households
In terms of married-couple households, the demographic groups most similar to Immigrants from Hong Kong are English (49.6%, a difference of 0.010%), Swedish (49.7%, a difference of 0.15%), European (49.6%, a difference of 0.17%), Scandinavian (49.6%, a difference of 0.17%), and Korean (49.7%, a difference of 0.18%).
| Demographics | Rating | Rank | Married-couple Households |
| Chinese | 100.0 /100 | #10 | Exceptional 50.4% |
| Immigrants | Pakistan | 100.0 /100 | #11 | Exceptional 50.1% |
| Swiss | 100.0 /100 | #12 | Exceptional 49.9% |
| Immigrants | Korea | 100.0 /100 | #13 | Exceptional 49.9% |
| Burmese | 100.0 /100 | #14 | Exceptional 49.8% |
| Koreans | 99.9 /100 | #15 | Exceptional 49.7% |
| Swedes | 99.9 /100 | #16 | Exceptional 49.7% |
| Immigrants | Hong Kong | 99.9 /100 | #17 | Exceptional 49.6% |
| English | 99.9 /100 | #18 | Exceptional 49.6% |
| Europeans | 99.9 /100 | #19 | Exceptional 49.6% |
| Scandinavians | 99.9 /100 | #20 | Exceptional 49.6% |
| Norwegians | 99.9 /100 | #21 | Exceptional 49.5% |
| Asians | 99.9 /100 | #22 | Exceptional 49.5% |
| Dutch | 99.9 /100 | #23 | Exceptional 49.5% |
| Czechs | 99.9 /100 | #24 | Exceptional 49.4% |
Demographics Similar to Creek by Married-couple Households
In terms of married-couple households, the demographic groups most similar to Creek are Yakama (45.2%, a difference of 0.10%), Immigrants from Spain (45.3%, a difference of 0.13%), Japanese (45.2%, a difference of 0.13%), Immigrants from Nepal (45.2%, a difference of 0.15%), and Immigrants from Portugal (45.2%, a difference of 0.15%).
| Demographics | Rating | Rank | Married-couple Households |
| Nepalese | 11.9 /100 | #205 | Poor 45.6% |
| Uruguayans | 10.4 /100 | #206 | Poor 45.5% |
| Immigrants | France | 8.8 /100 | #207 | Tragic 45.4% |
| Hispanics or Latinos | 8.7 /100 | #208 | Tragic 45.4% |
| Immigrants | Uzbekistan | 8.4 /100 | #209 | Tragic 45.4% |
| Cubans | 7.7 /100 | #210 | Tragic 45.4% |
| Immigrants | Spain | 7.3 /100 | #211 | Tragic 45.3% |
| Creek | 6.4 /100 | #212 | Tragic 45.3% |
| Yakama | 5.8 /100 | #213 | Tragic 45.2% |
| Japanese | 5.7 /100 | #214 | Tragic 45.2% |
| Immigrants | Nepal | 5.6 /100 | #215 | Tragic 45.2% |
| Immigrants | Portugal | 5.6 /100 | #216 | Tragic 45.2% |
| Panamanians | 5.5 /100 | #217 | Tragic 45.2% |
| Immigrants | Azores | 5.3 /100 | #218 | Tragic 45.2% |
| Nicaraguans | 5.3 /100 | #219 | Tragic 45.2% |