Immigrants from Haiti vs Hopi 3 or more Vehicles in Household
COMPARE
Immigrants from Haiti
Hopi
3 or more Vehicles in Household
3 or more Vehicles in Household Comparison
Immigrants from Haiti
Hopi
15.2%
3 OR MORE VEHICLES IN HOUSEHOLD
0.0/ 100
METRIC RATING
318th/ 347
METRIC RANK
18.2%
3 OR MORE VEHICLES IN HOUSEHOLD
2.5/ 100
METRIC RATING
242nd/ 347
METRIC RANK
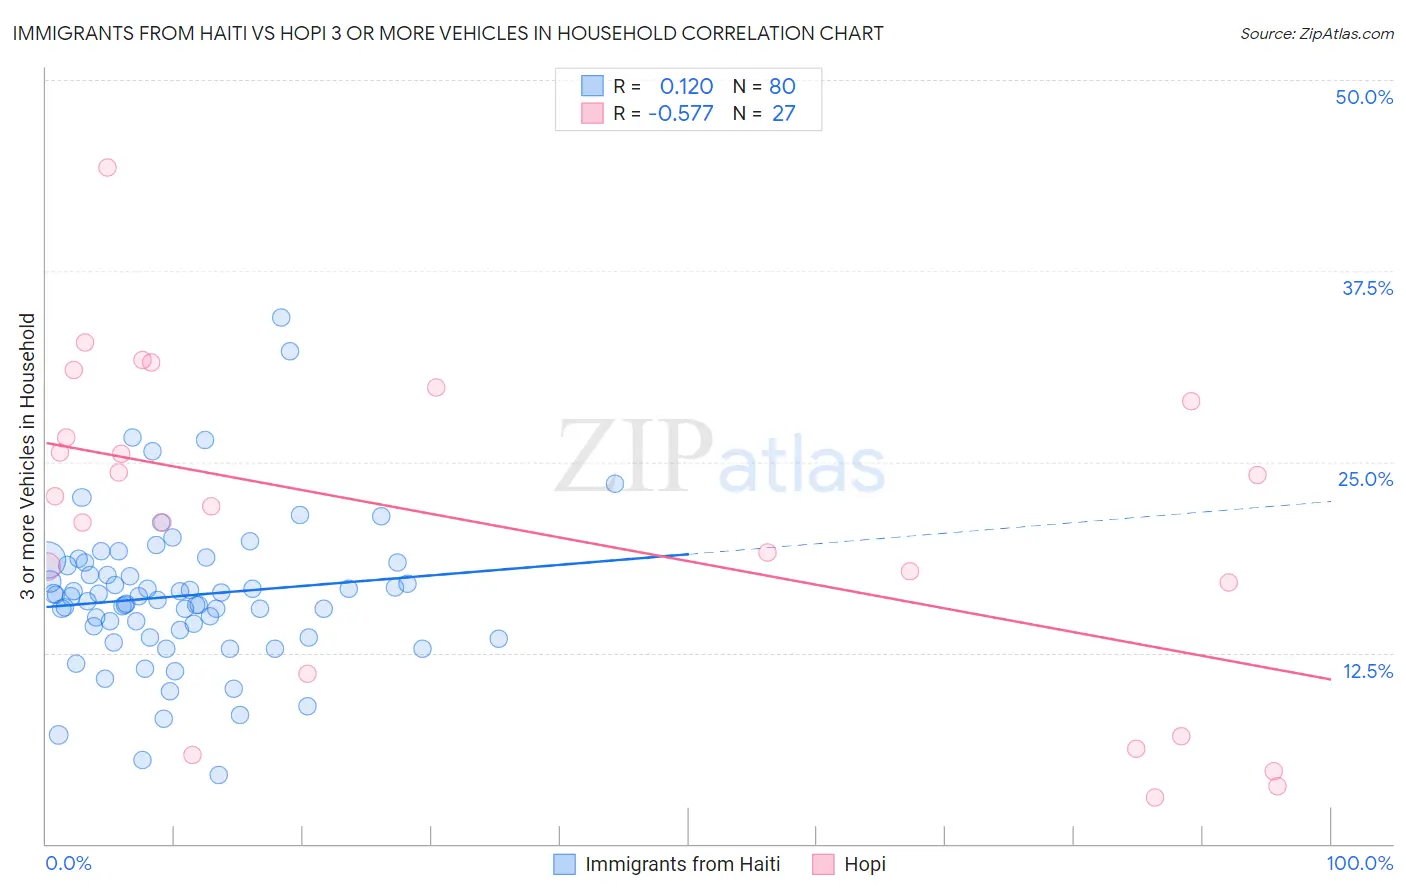
Immigrants from Haiti vs Hopi 3 or more Vehicles in Household Correlation Chart
The statistical analysis conducted on geographies consisting of 225,114,501 people shows a poor positive correlation between the proportion of Immigrants from Haiti and percentage of households with 3 or more vehicles available in the United States with a correlation coefficient (R) of 0.120 and weighted average of 15.2%. Similarly, the statistical analysis conducted on geographies consisting of 74,728,795 people shows a substantial negative correlation between the proportion of Hopi and percentage of households with 3 or more vehicles available in the United States with a correlation coefficient (R) of -0.577 and weighted average of 18.2%, a difference of 19.6%.
3 or more Vehicles in Household Correlation Summary
| Measurement | Immigrants from Haiti | Hopi |
| Minimum | 4.5% | 3.0% |
| Maximum | 34.5% | 44.3% |
| Range | 30.0% | 41.2% |
| Mean | 16.2% | 20.6% |
| Median | 16.1% | 22.1% |
| Interquartile 25% (IQ1) | 13.8% | 11.1% |
| Interquartile 75% (IQ3) | 18.3% | 29.0% |
| Interquartile Range (IQR) | 4.5% | 17.9% |
| Standard Deviation (Sample) | 5.0% | 10.6% |
| Standard Deviation (Population) | 4.9% | 10.4% |
Similar Demographics by 3 or more Vehicles in Household
Demographics Similar to Immigrants from Haiti by 3 or more Vehicles in Household
In terms of 3 or more vehicles in household, the demographic groups most similar to Immigrants from Haiti are Jamaican (15.2%, a difference of 0.20%), Cape Verdean (15.0%, a difference of 1.2%), U.S. Virgin Islander (15.4%, a difference of 1.4%), Haitian (15.5%, a difference of 1.9%), and Immigrants from Belarus (15.5%, a difference of 2.2%).
| Demographics | Rating | Rank | 3 or more Vehicles in Household |
| Albanians | 0.0 /100 | #311 | Tragic 15.8% |
| Puerto Ricans | 0.0 /100 | #312 | Tragic 15.6% |
| Immigrants | Israel | 0.0 /100 | #313 | Tragic 15.6% |
| Immigrants | Belarus | 0.0 /100 | #314 | Tragic 15.5% |
| Haitians | 0.0 /100 | #315 | Tragic 15.5% |
| U.S. Virgin Islanders | 0.0 /100 | #316 | Tragic 15.4% |
| Jamaicans | 0.0 /100 | #317 | Tragic 15.2% |
| Immigrants | Haiti | 0.0 /100 | #318 | Tragic 15.2% |
| Cape Verdeans | 0.0 /100 | #319 | Tragic 15.0% |
| Yup'ik | 0.0 /100 | #320 | Tragic 14.8% |
| Immigrants | Jamaica | 0.0 /100 | #321 | Tragic 14.7% |
| Immigrants | West Indies | 0.0 /100 | #322 | Tragic 14.6% |
| Immigrants | Caribbean | 0.0 /100 | #323 | Tragic 14.6% |
| Immigrants | Yemen | 0.0 /100 | #324 | Tragic 14.2% |
| Senegalese | 0.0 /100 | #325 | Tragic 14.2% |
Demographics Similar to Hopi by 3 or more Vehicles in Household
In terms of 3 or more vehicles in household, the demographic groups most similar to Hopi are African (18.2%, a difference of 0.11%), Immigrants from Europe (18.1%, a difference of 0.12%), Mongolian (18.1%, a difference of 0.24%), Immigrants from China (18.2%, a difference of 0.31%), and Immigrants from Belize (18.1%, a difference of 0.39%).
| Demographics | Rating | Rank | 3 or more Vehicles in Household |
| Sierra Leoneans | 3.9 /100 | #235 | Tragic 18.3% |
| Immigrants | Malaysia | 3.6 /100 | #236 | Tragic 18.3% |
| Indonesians | 3.5 /100 | #237 | Tragic 18.3% |
| Immigrants | Honduras | 3.1 /100 | #238 | Tragic 18.2% |
| Immigrants | Middle Africa | 3.1 /100 | #239 | Tragic 18.2% |
| Immigrants | China | 2.9 /100 | #240 | Tragic 18.2% |
| Africans | 2.7 /100 | #241 | Tragic 18.2% |
| Hopi | 2.5 /100 | #242 | Tragic 18.2% |
| Immigrants | Europe | 2.4 /100 | #243 | Tragic 18.1% |
| Mongolians | 2.3 /100 | #244 | Tragic 18.1% |
| Immigrants | Belize | 2.1 /100 | #245 | Tragic 18.1% |
| Immigrants | Australia | 2.0 /100 | #246 | Tragic 18.1% |
| Carpatho Rusyns | 1.9 /100 | #247 | Tragic 18.0% |
| Immigrants | Eastern Africa | 1.8 /100 | #248 | Tragic 18.0% |
| Immigrants | Saudi Arabia | 1.7 /100 | #249 | Tragic 18.0% |